 Indietro
College Algebra Unit 2 Study Guide: Functions, Graphs, and Equations
Guida di studio - Note intelligenti
 Appunti personalizzati basati sui tuoi materiali, ampliati con definizioni chiave, esempi e contesto.
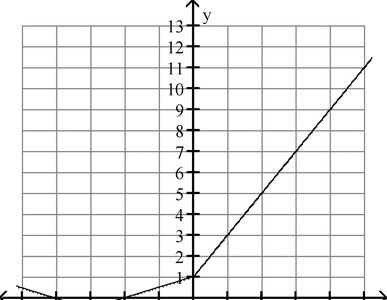
Q6. Use the graph to find the indicated function value: y = f(x). Find f(-4).
Background
Topic: Function Evaluation from a Graph
This question tests your ability to read a function value from its graph. You are asked to find the value of the function f at x = -4 by locating the corresponding point on the graph.
Key Terms:
Function: A relation that assigns exactly one output (y-value) for each input (x-value).
Function value: The y-coordinate corresponding to a given x-coordinate on the graph.
Step-by-Step Guidance
Locate the x-axis and find the point where x = -4.
Move vertically from x = -4 until you reach the graph of the function.
Identify the y-coordinate of the point where the graph intersects x = -4. This y-value is f(-4).
Check that you are reading from the correct graph and that the intersection is clear.
Try solving on your own before revealing the answer!
Final Answer: f(-4) = 0
At x = -4, the graph intersects the y-axis at y = 0, so f(-4) = 0.
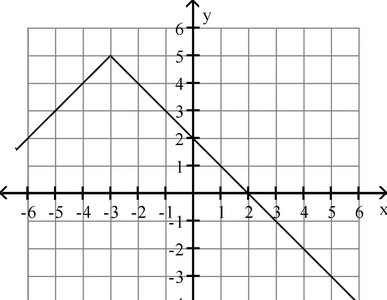
Q7. Use the graph to determine the function's domain and range.
Background
Topic: Domain and Range from a Graph
This question tests your understanding of domain (all possible x-values) and range (all possible y-values) for a function, as determined from its graph.
Key Terms:
Domain: The set of all input values (x-values) for which the function is defined.
Range: The set of all output values (y-values) that the function can take.
Step-by-Step Guidance
Examine the graph to see how far it extends horizontally (left and right) to determine the domain.
Check for any breaks, holes, or endpoints that might restrict the domain.
Look at the graph vertically (up and down) to determine the range.
Identify the lowest and highest y-values the graph reaches, and check for any restrictions.
Try solving on your own before revealing the answer!
Final Answer: Domain: ; Range:
The graph extends infinitely left and right, so the domain is all real numbers. The highest y-value is 5, so the range is all real numbers less than or equal to 5.
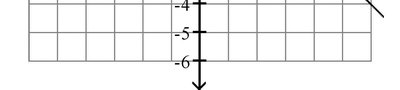
Q8. Identify the intervals where the function is increasing.
Background
Topic: Increasing Intervals of a Function
This question tests your ability to analyze a graph and determine where the function is increasing (where the y-values rise as x increases).
Key Terms:
Increasing interval: An interval where the function's output (y-value) increases as the input (x-value) increases.
Interval notation: A way to describe a set of numbers between two endpoints.
Step-by-Step Guidance
Look at the graph and identify sections where the curve moves upward as you go from left to right.
Note the x-values at the start and end of each increasing section.
Express these intervals using proper interval notation.
Check for multiple increasing intervals and list them separately if needed.
Try solving on your own before revealing the answer!
Final Answer: Increasing on and
The function rises in these intervals as you move from left to right on the graph.
