 Indietro
Equations of Lines and Linear Modeling in College Algebra
Guida di studio - Note intelligenti
 Appunti personalizzati basati sui tuoi materiali, ampliati con definizioni chiave, esempi e contesto.
Equations of Lines
Point-Slope Form
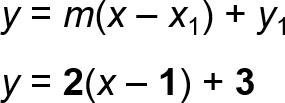
The point-slope form of the equation of a line is useful when you know the slope of the line and one point through which it passes. The general formula is:
Formula:
Here, m is the slope, and is a point on the line.
Example: Find the equation of the line passing through the points and .
First, calculate the slope:
Using point :
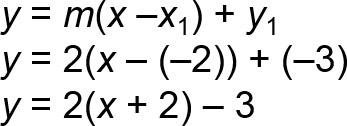
Using point :
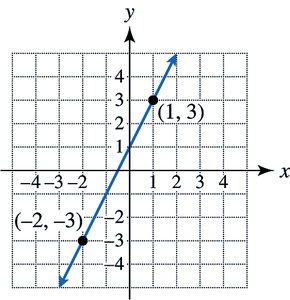
Graph: The line passes through and , as shown below.
Slope-Intercept Form
The slope-intercept form is one of the most common forms for the equation of a line. It is especially useful for quickly identifying the slope and y-intercept.
Formula:
Here, m is the slope and b is the y-intercept (the value of y when ).

Example: Find the slope-intercept form of the line passing through and .
Calculate the slope:
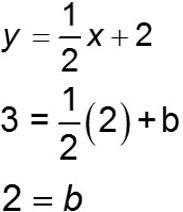
Substitute into to solve for :
So, the equation is .
Standard Form
The standard form of a line is another common way to write linear equations, especially useful for finding intercepts.
Formula:
Where , , and are constants, and $A$ and $B$ are not both zero.
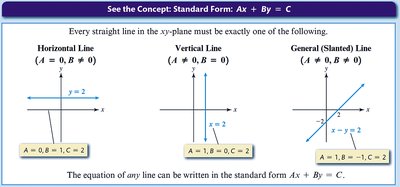
Finding Intercepts
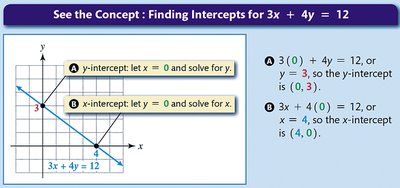
Intercepts are points where the line crosses the axes.
x-intercept: Set and solve for .
y-intercept: Set and solve for .
Example: For :
x-intercept: (point )
y-intercept: (point )
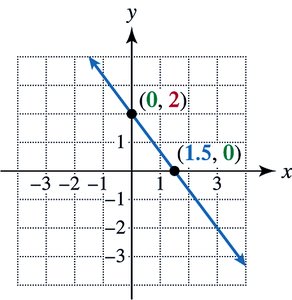
Graphical Interpretation of Intercepts
Intercepts can be visualized on the coordinate plane, aiding in graphing lines quickly.
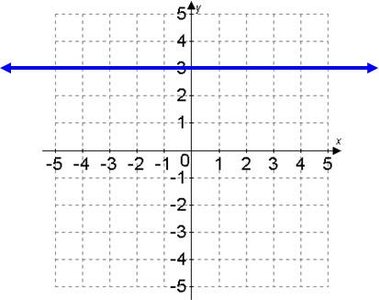
Horizontal and Vertical Lines
Special cases of linear equations include horizontal and vertical lines:
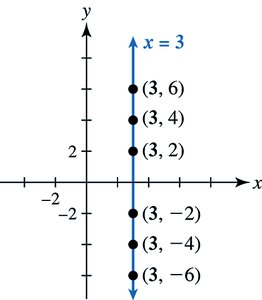
Horizontal line: (slope ), passes through
Vertical line: (slope undefined), passes through
Modeling Data with Lines and Linear Functions
Interpolation and Extrapolation
Interpolation is estimating values within the range of known data points, while extrapolation is estimating values outside that range. Interpolation is generally more reliable than extrapolation.
Example: Modeling iPod Sales
Given sales data for 2008 and 2011, we can model the trend with a linear equation:
Points: and
Slope:
Equation:
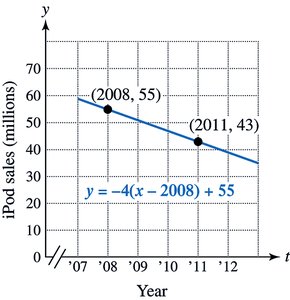
Estimating 2010 sales: million (interpolation, since 2010 is between 2008 and 2011).
Estimating 2023 sales: million (extrapolation, result is not realistic as sales cannot be negative).
Example: Modeling Global Car Shipments
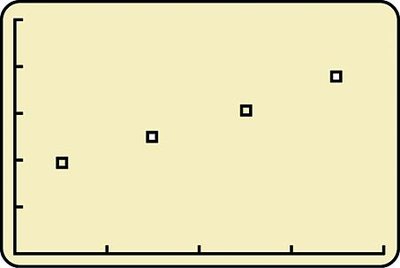
Given the following data:
Year | Car Shipments (millions) |
|---|---|
2013 | 69 |
2015 | 75 |
2017 | 81 |
2019 | 88 |
a. Scatterplot:
b. Point-slope form: Using and :
Slope:
Equation:
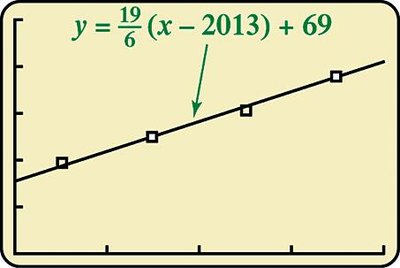
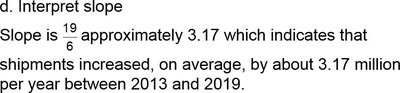
d. Interpretation: The slope means shipments increased by about 3.17 million per year between 2013 and 2019.
e. Estimate for 2020: million (extrapolation, since 2020 is outside the data range).
Summary Table: Forms of Linear Equations
Form | Equation | Key Features |
|---|---|---|
Point-Slope | Given slope and a point | |
Slope-Intercept | Slope and y-intercept | |
Standard | General form, easy for intercepts | |
Horizontal Line | Slope | |
Vertical Line | Slope undefined |
Additional info: Linear modeling is foundational for understanding relationships in data and predicting future values, but caution should be used with extrapolation as predictions may become unreliable outside the observed range.
