Indietro
Functions and Their Representations: College Algebra Study Notes
Guida di studio - Note intelligenti
 Appunti personalizzati basati sui tuoi materiali, ampliati con definizioni chiave, esempi e contesto.
Functions and Their Representations
Definition and Basic Concepts
A function is a mathematical process that assigns each input exactly one output. This concept is fundamental in algebra and is used to model relationships between quantities.
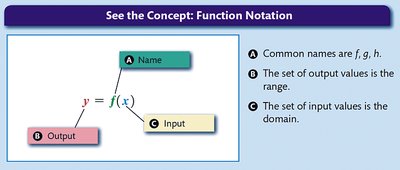
Function Notation: The notation means that function f with input x produces output y.
Dependent Variable: The output variable (usually y).
Independent Variable: The input variable (usually x).
Common function names: f, g, h.
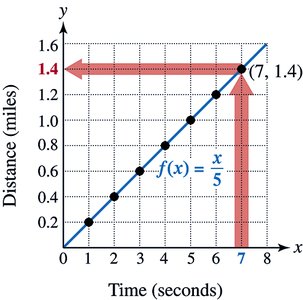
Example: In the context of thunder and lightning, the distance y (in miles) from a lightning bolt can be calculated by dividing the time lapse x (in seconds) by 5: .
Domain and Range
The domain of a function is the set of all possible input values, while the range is the set of all possible output values.
Domain: All meaningful inputs x.
Range: All corresponding outputs y.
Example: For a function computing the height of a thrown ball, the domain is the time while the ball is in flight, and the range is the set of heights attained.
Representations of Functions
Functions can be represented in four main ways:
Verbal: Describes the function in words.
Numerical: Uses tables of values.
Symbolic: Uses formulas or equations.
Graphical: Uses graphs to show the relationship.
Verbal Representation
Example: "Divide x seconds by 5 to obtain y miles."
Numerical Representation
Example table for the lightning function:
x (seconds) | y (miles) |
|---|---|
1 | 0.2 |
2 | 0.4 |
3 | 0.6 |
4 | 0.8 |
5 | 1.0 |
6 | 1.2 |
7 | 1.4 |
Symbolic Representation
Example:
Graphical Representation
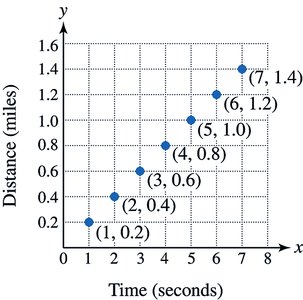
A graph visually pairs each x-input with a y-output. The scatterplot and line graph below show the function .
Four Representations Example
Consider :
x | y |
|---|---|
-2 | 5 |
-1 | 2 |
0 | 1 |
1 | 2 |
2 | 5 |
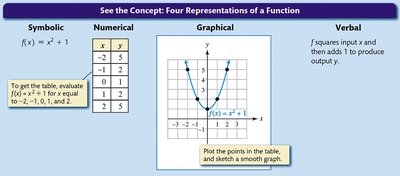
Verbal: "f squares input x and then adds 1 to produce output y."
Formal Definition of a Function
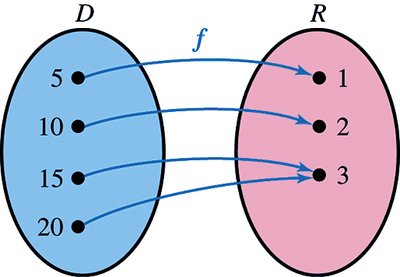
A function is a relation in which each element of the domain corresponds to exactly one element in the range. Ordered pairs for a function can be finite or infinite.
Example:
Domain:
Range:
Set-Builder and Interval Notation
Set-builder notation and interval notation are used to describe domains and ranges concisely.
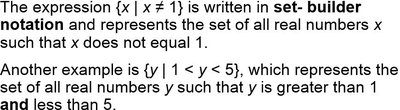
Set-builder notation: means all real numbers x except 1.
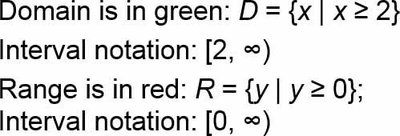
Interval notation: means all real numbers x greater than or equal to 2.
Evaluating Functions and Determining Domain
To evaluate a function, substitute the input value into the formula. The domain is the set of all inputs for which the function is defined.
Example:
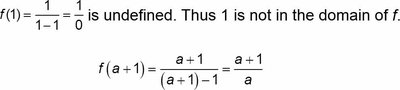
is undefined because division by zero occurs.
Domain:
Example:
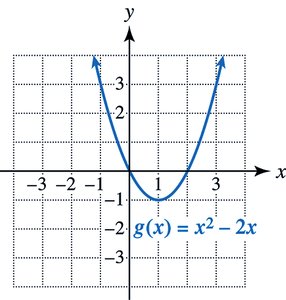
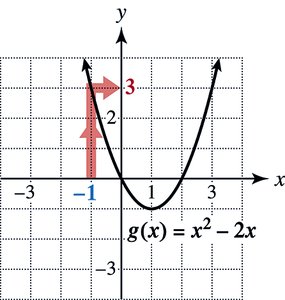
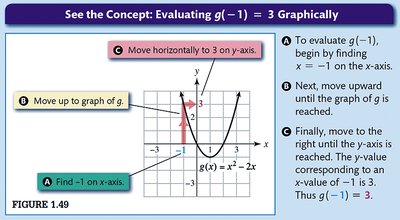
Evaluating Functions Symbolically and Graphically
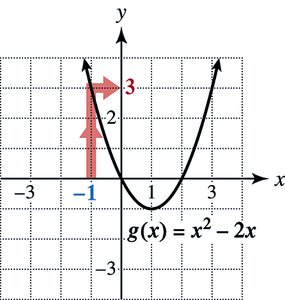
Functions can be evaluated using their formula or by reading values from their graph.
Example:
Domain: All real numbers
Range:
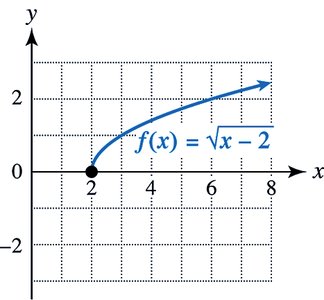
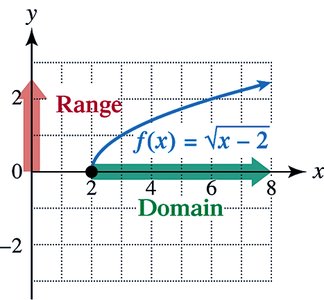
Domain and Range Graphically
Domain and range can be determined from a graph. If a value is not on the graph, the function is undefined at that input.
Example:
Domain: or
Range: or
Graphing Calculators and Functions
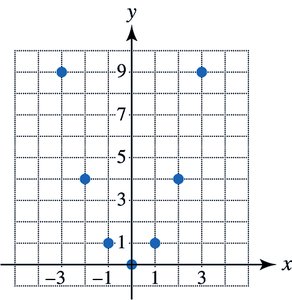
Graphing calculators can efficiently create graphs and tables for functions. The process involves plotting points and connecting them to form a curve.
Example:
Table of values:
x | y |
|---|---|
-3 | 9 |
-2 | 4 |
-1 | 1 |
0 | 0 |
1 | 1 |
2 | 4 |
3 | 9 |
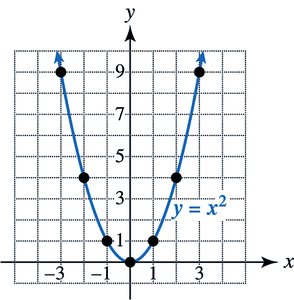
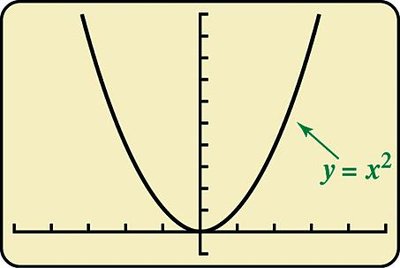
Identifying Functions: Vertical Line Test
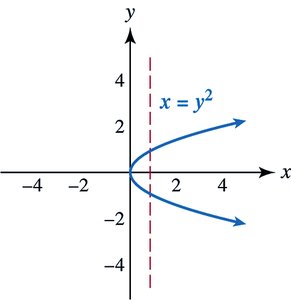
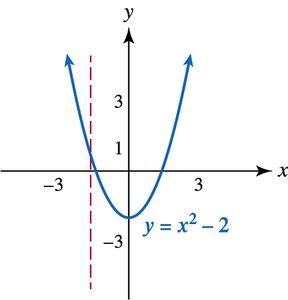
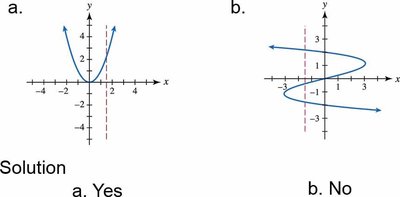
The vertical line test is used to determine if a graph represents a function. If every vertical line intersects the graph at most once, it is a function.
If a vertical line intersects more than once, it is not a function.
Functions Represented by Diagrams and Equations
Functions can also be represented by diagrams (mapping) and equations.
Diagram: Shows how each input is paired with exactly one output.
Equation: defines a function where each input x has one output y.
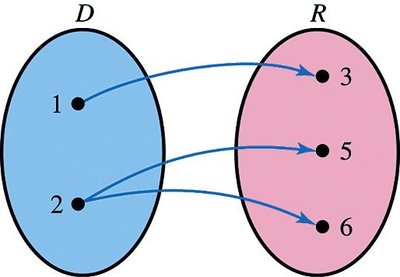
Examples: Identifying Functions
Example a: is not a function of x, since one x can correspond to two y values.
Example b: is a function, since each x gives exactly one y.