 Indietro
Functions, Domain, and Range – College Algebra Study Guidance
Guida di studio - Note intelligenti
 Appunti personalizzati basati sui tuoi materiali, ampliati con definizioni chiave, esempi e contesto.
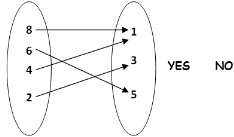
Q1. Decide whether the following relation is a function. Then state the domain and range.
Background
Topic: Functions, Domain, and Range
This question tests your understanding of what makes a relation a function, and how to identify the domain and range from a mapping diagram.
Key Terms:
Function: A relation in which each input (element from the domain) is paired with exactly one output (element from the range).
Domain: The set of all possible input values (usually x-values).
Range: The set of all possible output values (usually y-values).
Step-by-Step Guidance
Examine the arrows in the diagram. Check if each element in the left set (domain) points to only one element in the right set (range).
If any element in the domain points to more than one element in the range, the relation is not a function. If each points to only one, it is a function.
List all the elements in the left set to determine the domain.
List all the elements in the right set that receive arrows to determine the range.
Check for repeated outputs or missing values in the range.
Try solving on your own before revealing the answer!
Final Answer:
The relation is a function because each input from the domain maps to exactly one output in the range.
Domain: {8, 6, 4, 2}
Range: {1, 3, 5}
Each element in the domain has only one arrow going to the range, so the definition of a function is satisfied.
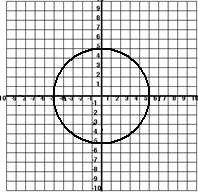
Q2. Decide whether the following relation is a function. Then state the domain and range.
Background
Topic: Functions, Domain, and Range (Graphical Representation)
This question tests your ability to determine if a graph represents a function and to identify its domain and range.
Key Terms:
Vertical Line Test: A graph represents a function if no vertical line intersects the graph at more than one point.
Domain: All possible x-values for which the graph exists.
Range: All possible y-values for which the graph exists.
Step-by-Step Guidance
Apply the vertical line test: Imagine drawing vertical lines across the graph. Does any line touch the circle at more than one point?
If yes, the graph does not represent a function. If no, it does.
Identify the lowest and highest x-values covered by the circle to determine the domain.
Identify the lowest and highest y-values covered by the circle to determine the range.
Try solving on your own before revealing the answer!
Final Answer:
The graph is not a function because vertical lines intersect the circle at two points.
Domain: The set of x-values from the leftmost to the rightmost point of the circle.
Range: The set of y-values from the bottommost to the topmost point of the circle.
For a circle centered at (0,0) with radius r, domain and range are .
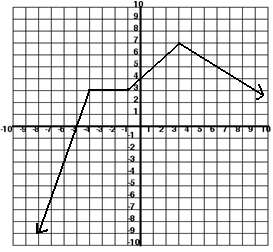
Q3. Decide whether the following relation is a function. Then state the domain and range.
Background
Topic: Functions, Domain, and Range (Graphical Representation)
This question tests your ability to analyze a piecewise graph to determine if it represents a function and to find its domain and range.
Key Terms:
Vertical Line Test: Used to determine if a graph is a function.
Domain: All x-values for which the graph exists.
Range: All y-values for which the graph exists.
Step-by-Step Guidance
Apply the vertical line test to the graph. Does any vertical line intersect the graph at more than one point?
If not, the graph is a function. If so, it is not.
Identify the leftmost and rightmost x-values to determine the domain.
Identify the lowest and highest y-values to determine the range.
Try solving on your own before revealing the answer!
Final Answer:
The graph is a function because it passes the vertical line test.
Domain: All real numbers (or the interval shown on the graph).
Range: All y-values covered by the graph (from the lowest to the highest point).
Each x-value corresponds to exactly one y-value, so it is a function.
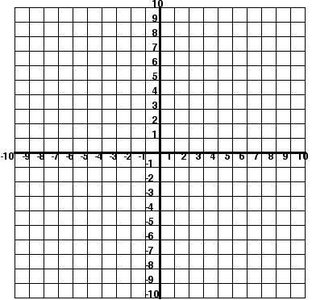
Q4. Decide whether the following relation is a function. Then state the domain and range.
Background
Topic: Functions, Domain, and Range (Graphical Representation)
This question is likely asking you to draw or analyze a function on a blank grid, or to consider what the domain and range would be for a function you might graph.
Key Terms:
Function: Each input has exactly one output.
Domain: All possible x-values.
Range: All possible y-values.
Step-by-Step Guidance
Think about what type of function you might graph (e.g., linear, quadratic, etc.).
For a linear function, domain and range are typically all real numbers.
For other types, consider restrictions (e.g., square root functions have domain ).
Try solving on your own before revealing the answer!
Final Answer:
If you graph a linear function, the domain and range are all real numbers.
If you graph a quadratic function, the domain is all real numbers, but the range is (for ).
The answer depends on the function you choose to graph.
Q5. Decide whether the following relation is a function. Then state the domain and range.
Background
Topic: Functions, Domain, and Range (Graphical Representation)
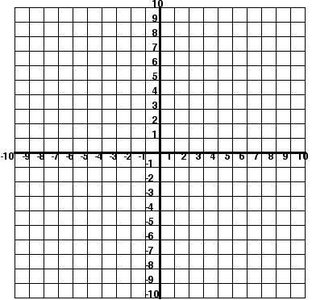
This question is similar to Q4, likely asking you to draw or analyze a function on a blank grid.
Key Terms:
Function: Each input has exactly one output.
Domain: All possible x-values.
Range: All possible y-values.
Step-by-Step Guidance
Consider what type of function you might graph (linear, quadratic, etc.).
For a linear function, domain and range are typically all real numbers.
For other types, consider restrictions (e.g., square root functions have domain ).
Try solving on your own before revealing the answer!
Final Answer:
If you graph a linear function, the domain and range are all real numbers.
If you graph a quadratic function, the domain is all real numbers, but the range is (for ).
The answer depends on the function you choose to graph.
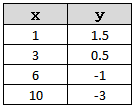
Q12. The table of values below is from a linear function. What is the slope of the linear function?
Background
Topic: Slope of a Linear Function
This question tests your ability to calculate the slope from a table of values.
Key Formula:
Slope formula:
Step-by-Step Guidance
Pick any two points from the table. For example, and .
Plug the values into the slope formula: .
Simplify the numerator and denominator separately.
Calculate the slope for these two points. You can check with other pairs to confirm the slope is consistent.
Try solving on your own before revealing the answer!
Final Answer:
The slope is .
Each pair of points gives the same slope, confirming the function is linear.
