 Indietro
Graphing Equations and Ordered Pairs in the Rectangular Coordinate System
Guida di studio - Note intelligenti
 Appunti personalizzati basati sui tuoi materiali, ampliati con definizioni chiave, esempi e contesto.
Graphing Equations and Ordered Pairs
Introduction to Graphing Equations
Graphing equations is a foundational skill in College Algebra, allowing us to visually represent relationships between variables. The rectangular coordinate system, also known as the Cartesian plane, is used to plot points, lines, and curves that represent equations.
Plotting Ordered Pairs
Understanding Ordered Pairs
An ordered pair is a pair of numbers written in the form (x, y), where x is the horizontal coordinate and y is the vertical coordinate. Each ordered pair corresponds to a unique point in the plane, and each point in the plane corresponds to a unique ordered pair.
x-coordinate: The first number in the pair; determines horizontal position.
y-coordinate: The second number in the pair; determines vertical position.
To plot an ordered pair (x, y):
Start at the origin (0, 0).
Move x units right (if x is positive) or left (if x is negative).
Move y units up (if y is positive) or down (if y is negative).
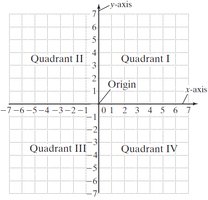
The plane is divided into four quadrants:
Quadrant I: x > 0, y > 0
Quadrant II: x < 0, y > 0
Quadrant III: x < 0, y < 0
Quadrant IV: x > 0, y < 0
Origin: The point (0, 0) where the x-axis and y-axis intersect.
Example: Identifying Quadrants and Axes
Ordered Pair | Location |
|---|---|
(4, 2) | Quadrant I |
(-3, -2) | Quadrant III |
(2, -3) | Quadrant IV |
(0, 4) | y-axis |
(5, 0) | x-axis |
The Rectangular Coordinate System
Key Terms and Structure
x-axis: The horizontal number line.
y-axis: The vertical number line.
Origin: The intersection point of the axes, (0, 0).
Quadrants: Four regions created by the axes.
Each point in the plane is uniquely identified by its ordered pair (x, y).
Linear Equations in Two Variables
Definition and Standard Form
A linear equation in two variables is an equation that can be written in the form:
where A, B, and C are real numbers, and A and B are not both zero. This is called the standard form of a linear equation.
Determining Solutions to Linear Equations
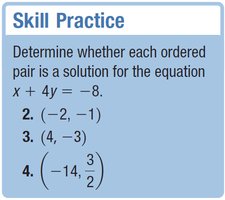
An ordered pair (x, y) is a solution to a linear equation if substituting x and y into the equation makes it a true statement.
Example 1: Is (3, –2) a solution to ?
Substitute x = 3, y = –2:
Since –4 = –4, (3, –2) is a solution.
Example 2: Is (–1, 6) a solution to ?
Substitute x = –1, y = 6:
Since –9 ≠ 5, (–1, 6) is not a solution.
Graphing Linear Equations
Graphing by Plotting Points
To graph a linear equation, find several ordered pair solutions and plot them. Connect the points to form a straight line.
If the equation is solved for y, choose values for x and solve for y.
If the equation is solved for x, choose values for y and solve for x.
Example: Graph
x | y |
|---|---|
0 | 3 |
\frac{5}{3} | 2 |
5 | 0 |
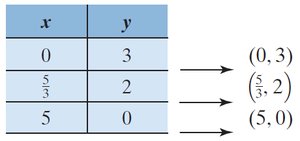
Plot the points (0, 3), (5/3, 2), and (5, 0), then draw the line through them.
Helpful Hint
Choose values for the variable that is isolated to avoid fractions.
Each linear equation in two variables graphs as a straight line.
Graphing Nonlinear Equations
Examples of Nonlinear Graphs
Not all equations graph as straight lines. For example:
Parabola: graphs as a U-shaped curve.
Absolute Value: graphs as a V-shaped curve.
To graph these, create a table of values for x and compute the corresponding y-values, then plot the points and connect them smoothly.
Tables: Comparing Data Representations
Tables vs. Graphs
Data can be represented in tables or graphs. Tables list values explicitly, while graphs provide a visual representation of the relationship between variables.
x | y |
|---|---|
0 | 3 |
\frac{5}{3} | 2 |
5 | 0 |
Each row in the table corresponds to a point on the graph.
Summary: Understanding how to plot ordered pairs, identify quadrants, and graph linear and nonlinear equations is essential for success in College Algebra. Practice by plotting points, checking solutions, and drawing graphs to reinforce these concepts.
