 Indietro
Graphing Equations and Ordered Pairs in the Rectangular Coordinate System
Guida di studio - Note intelligenti
 Appunti personalizzati basati sui tuoi materiali, ampliati con definizioni chiave, esempi e contesto.
Graphing Equations
Introduction to Graphing Equations
Graphing equations is a fundamental skill in College Algebra, allowing students to visually represent relationships between variables. The process begins with understanding how to plot ordered pairs and interpret data using tables and graphs.
Representing Data: Tables vs. Graphs
Data can be represented in tabular form or as a graph. Tables list values for variables, while graphs provide a visual representation of these relationships, making it easier to identify patterns and trends.
The Rectangular Coordinate System
Key Components
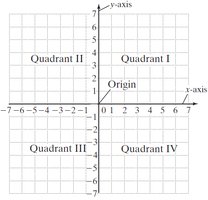
The rectangular coordinate system (also known as the Cartesian plane) is used to plot points and graph equations. It consists of two perpendicular axes:
x-axis: The horizontal number line
y-axis: The vertical number line
Origin: The point (0, 0) where the axes intersect
Quadrants: Four regions created by the intersection of the axes
Ordered Pairs
An ordered pair (x, y) represents a point in the plane. The x-coordinate is the first number and indicates horizontal position; the y-coordinate is the second number and indicates vertical position.
To plot (x, y): Start at the origin, move x units left/right, then y units up/down.
The order of coordinates is crucial: (–4, 2) and (2, –4) are in different locations.
Quadrants and Axes
Each point lies in one of the four quadrants or on an axis:
Quadrant I: x > 0, y > 0
Quadrant II: x < 0, y > 0
Quadrant III: x < 0, y < 0
Quadrant IV: x > 0, y < 0
Points with x = 0 lie on the y-axis; points with y = 0 lie on the x-axis.
Example: Plotting Ordered Pairs
Consider the following points:
(4, 2): Quadrant I
(–3, –2): Quadrant III
(2, –3): Quadrant IV
(0, 4): y-axis
(5, 0): x-axis
Linear Equations in Two Variables
Standard Form
A linear equation in two variables can be written in standard form:
where A, B, and C are real numbers, and A and B are not both zero.
Solutions to Linear Equations
An ordered pair (x, y) is a solution if substituting x and y into the equation yields a true statement.
Example: Is (3, –2) a solution to ?
Substitute: (True)
So (3, –2) is a solution.
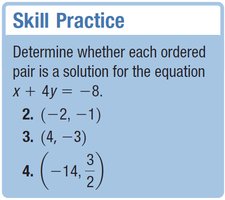
Skill Practice Table
The following table helps determine whether ordered pairs are solutions to a given equation:
x | y |
|---|---|
0 | |
2 | |
5 |
Graphing Linear Equations
Finding Ordered Pair Solutions
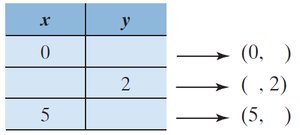
To graph a linear equation, select values for one variable and solve for the other. For example, for :
Let x = 4: → (4, 7)
Let x = 0: → (0, 3)
Let x = –4: → (–4, –1)
Plot these points and draw the line through them.
Graphing Example: Standard Form
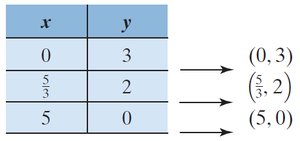
For , choose values for x and solve for y:
x | y |
|---|---|
0 | 3 |
2 | |
5 | 0 |
Graphing Nonlinear Equations
Parabolas and Absolute Value Graphs
Not all equations are linear. For example:
Parabola:
Absolute Value:
To graph these, select values for x, compute y, and plot the points. The resulting graphs are not straight lines.
Helpful Hints for Graphing
If the equation is solved for y, choose x-values to find ordered pairs.
If the equation is solved for x, choose y-values.
Each ordered pair corresponds to exactly one point in the plane.
Summary Table: Ordered Pairs and Quadrants
Ordered Pair | Quadrant/Axis |
|---|---|
(4, 2) | Quadrant I |
(–3, –2) | Quadrant III |
(2, –3) | Quadrant IV |
(0, 4) | y-axis |
(5, 0) | x-axis |
Additional info: Academic context was added to clarify the process of graphing equations, the meaning of ordered pairs, and the structure of the coordinate plane. Examples and tables were expanded for completeness.
