 Indietro
Linear Functions and Their Rates of Change
Guida di studio - Note intelligenti
 Appunti personalizzati basati sui tuoi materiali, ampliati con definizioni chiave, esempi e contesto.
Section 1.4: Types of Functions and Their Rates of Change
Linear Functions
A linear function is a function of the form , where m and b are constants. Linear functions have a constant rate of change, and their graphs are straight lines.
Slope (m): The rate of change of the function.
Y-intercept (b): The point where the line crosses the y-axis, given by (0, b).
Example: For , the slope is and the y-intercept is .
Example: Write a formula for a linear function with slope and y-intercept (0, 4): .
Constant Functions
If , the function becomes , which is a constant function. The graph of a constant function is a horizontal line crossing the y-axis at (0, b).
Slope: 0
Graph: Horizontal line
Example: For , the slope is 0 and the graph is a horizontal line crossing the y-axis at (0, 2).
Identifying Linear Functions
A function is linear if it can be written in the form . If , the function is not constant.
Example: is linear with and ; it is not constant.
Finding the Slope Between Two Points
The slope of a line passing through points and is given by:
Vertical change (rise):
Horizontal change (run):
If the denominator is 0, the slope is undefined and the line is vertical.
Example: Find the slope of the line through (2, 5) and (6, 4):
This means for every run of 4 units, the line goes down by 1 unit.
Example: Find the slope of the line through (1, 2) and (1, 3):
The slope is undefined; the line is vertical.
Graphing Linear Functions by Hand
To graph :
Plot the y-intercept (0, b).
From the y-intercept, use the slope (rise/run) to find a second point.
Draw the line connecting the two points.
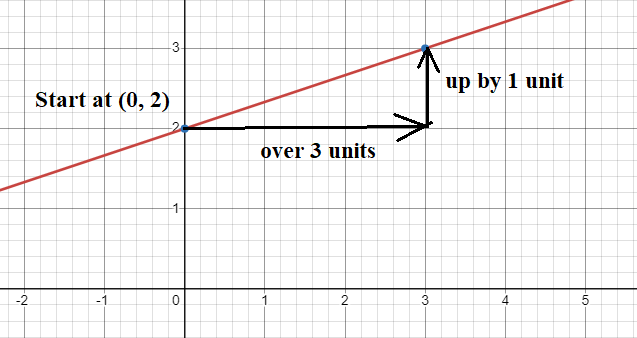
Example: Graph . The slope is and the y-intercept is (0, 2).
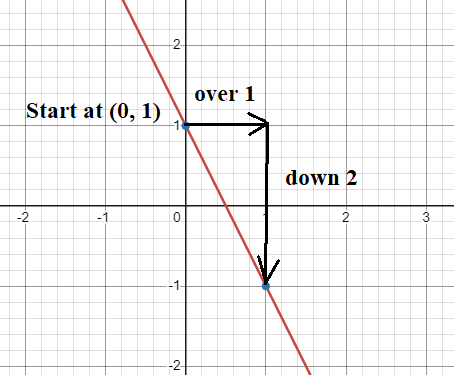
Example: Graph . The slope is -2 and the y-intercept is (0, 1).
X-Intercepts and Zeros of Linear Functions
The x-intercept is the point where the line crosses the x-axis. It can be found by solving for x. The x-value found is called a zero of the function.
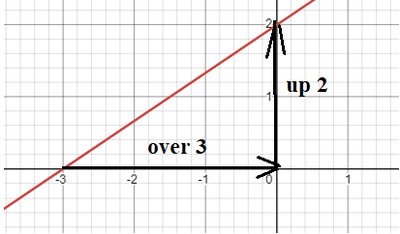
Example: For , the y-intercept is (0, 2) and the x-intercept is (-3, 0).
Interpreting Slope in Applications
The slope of a linear function can represent a rate of change in real-world contexts.
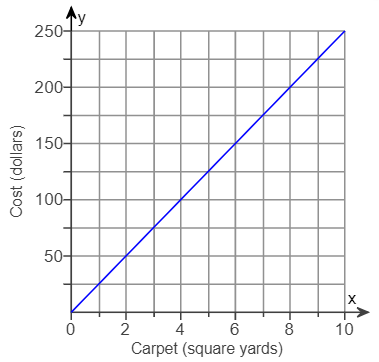
Example: The cost of buying x square yards of carpet is given by a linear function. If the slope is 25, it means the cost is $25 per square yard.
Example: A driver's distance from home after x hours is . The slope is 60, meaning the driver travels at 60 miles per hour.
Intervals of Increase, Decrease, and Constancy
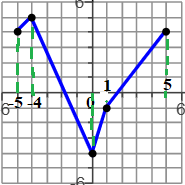
A function is increasing on an interval if its graph goes up from left to right, decreasing if it goes down, and constant if it is horizontal. These intervals are described using x-values.
Example: From a given graph:
Increasing on intervals (-5, -4) and (0, 5)
Decreasing on interval (-4, 0)
Not constant on any interval
Additional info: The notes cover the fundamental properties of linear functions, including their graphical representation, calculation of slope, and interpretation in real-world contexts. The included images directly illustrate the concepts of slope, y-intercept, x-intercept, and intervals of increase/decrease.
