 Indietro
Organizing Data: Frequency Distribution in College Algebra
Guida di studio - Note intelligenti
 Appunti personalizzati basati sui tuoi materiali, ampliati con definizioni chiave, esempi e contesto.
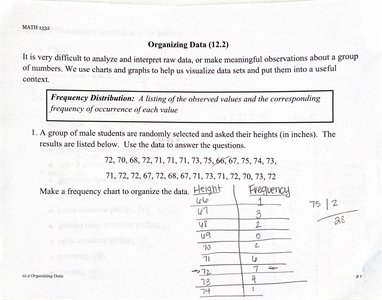
Q1. Make a frequency chart to organize the data of male students' heights (in inches).
Background
Topic: Frequency Distribution and Data Organization
This question is testing your ability to organize raw data into a frequency chart, which is a fundamental skill in statistics and data analysis. Frequency charts help summarize and visualize data, making it easier to interpret and analyze patterns.
Key Terms and Formulas
Frequency Distribution: A table that shows each distinct value (or range of values) and how often it occurs in the data set.
Frequency: The number of times a particular value appears in the data.
Step-by-Step Guidance
List all the unique heights from the data set. Arrange them in ascending order for clarity.
Count how many times each height appears in the data set. This count is the frequency for each height.
Record each height and its corresponding frequency in a table format. The table should have two columns: one for "Height" and one for "Frequency".
Double-check your counts to ensure accuracy. Make sure the sum of all frequencies matches the total number of data points.
Set up the table, but leave the final frequency counts for the student to fill in based on their own calculations.
Try solving on your own before revealing the answer!
Final Answer: Frequency Chart
The completed frequency chart is:
Height | Frequency |
|---|---|
66 | 1 |
67 | 1 |
68 | 2 |
69 | 2 |
70 | 3 |
71 | 2 |
72 | 2 |
73 | 2 |
74 | 1 |
75 | 1 |
This chart organizes the data so you can easily see how many students have each height. The sum of the frequencies matches the total number of data points.
