 Indietro
Types of Functions and Their Properties: College Algebra Study Notes
Guida di studio - Note intelligenti
 Appunti personalizzati basati sui tuoi materiali, ampliati con definizioni chiave, esempi e contesto.
Types of Functions
Basic Function Types
Understanding the basic types of functions is fundamental in College Algebra. Functions can be classified by their algebraic form and graphical behavior.
Linear Functions: Functions of the form where and are constants. Their graphs are straight lines.
Quadratic Functions: Functions of the form . Their graphs are parabolas.
Square Root Functions: Functions of the form or .
Absolute Value Functions: Functions of the form .
Cubic Functions: Functions of the form .
Piecewise Functions: Functions defined by different expressions for different intervals of the domain.
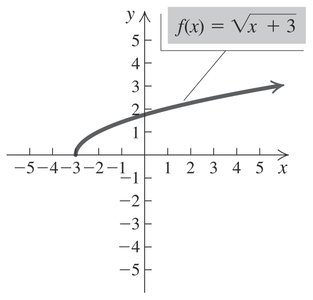
Example: The function is a square root function shifted left by 3 units.
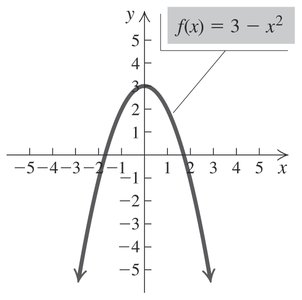
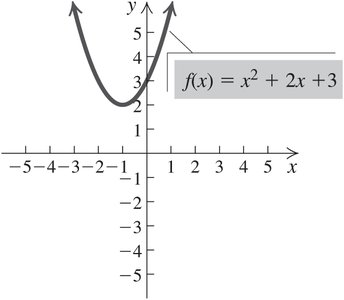
Example: The function is a quadratic function reflected across the x-axis and shifted up by 3 units.
Piecewise Functions
Piecewise functions are defined by different expressions depending on the value of the input variable.
Definition: A piecewise function uses multiple sub-functions, each with its own domain.
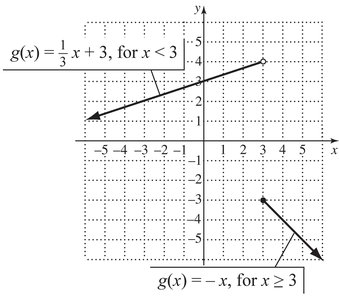
Example: for , for .
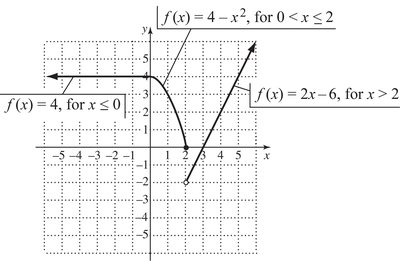
Example: for , for , for .
Greatest Integer Function
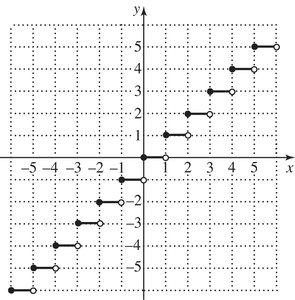
The greatest integer function, also known as the floor function, returns the largest integer less than or equal to a given number.
Notation:
Graph: The graph is a step function, with jumps at integer values.
Domain: All real numbers.
Range: All integers.
Analyzing Graphs of Functions
Zeros of Functions
The zero of a function is the input value where the output is zero. Graphically, zeros correspond to x-intercepts.
Definition:
Example: For , the zero is .
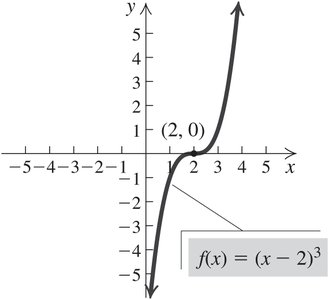
Example: For , the zeros are and .
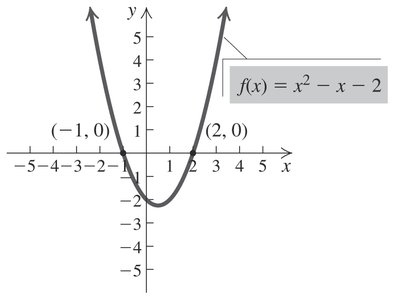
Example: For , the zero is .
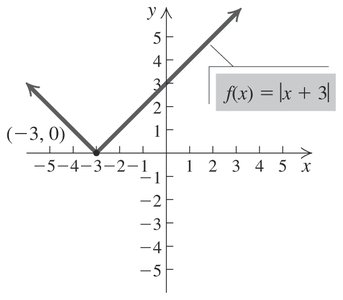
Example: For , there are no real zeros.
Intervals of Increase, Decrease, and Constancy
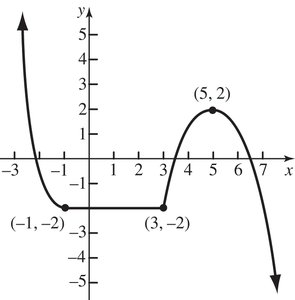
A function may be increasing, decreasing, or constant over different intervals of its domain.
Increasing: The function's output rises as the input increases.
Decreasing: The function's output falls as the input increases.
Constant: The function's output remains unchanged as the input increases.
Example: The graph below shows intervals of increase, decrease, and constancy.
Algebra of Functions
Operations on Functions
Functions can be combined using addition, subtraction, multiplication, and division.
Sum:
Difference:
Product:
Quotient: ,
Domain: The domain of the combined function is the intersection of the domains of and , except for division where .
Composition of Functions
Composite Functions
The composition of two functions and is written as . The domain of the composite function is the set of all in the domain of $g$ for which is in the domain of $f$.
Example: If and , then .
Symmetry of Functions
Algebraic Tests of Symmetry
Symmetry helps classify functions and their graphs.
x-axis Symmetry: Replace with ; if the equation is unchanged, the graph is symmetric about the x-axis.
y-axis Symmetry: Replace with ; if the equation is unchanged, the graph is symmetric about the y-axis.
Origin Symmetry: Replace with and with ; if the equation is unchanged, the graph is symmetric about the origin.
Even Functions: for all in the domain. Graph is symmetric about the y-axis.
Odd Functions: for all in the domain. Graph is symmetric about the origin.
Transformations of Functions
Vertical and Horizontal Translations
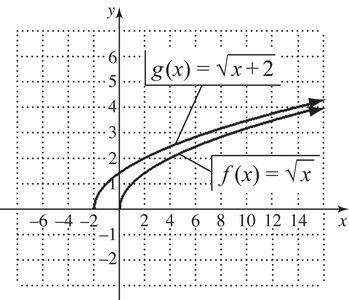
Translations shift the graph of a function up, down, left, or right.
Vertical Translation: shifts up by units; shifts down by $b$ units.
Horizontal Translation: shifts right by units; shifts left by $d$ units.
Example: Comparing and shows a leftward shift by 2 units.
Reflections
Reflections flip the graph across the x-axis or y-axis.
x-axis Reflection:
y-axis Reflection:
Example: The graph of is the reflection of across the x-axis.
Example: The graph of is the reflection of across the y-axis.
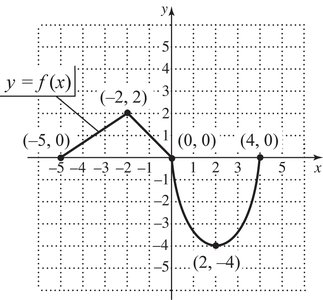
Vertical and Horizontal Stretching/Shrinking
Stretching and shrinking change the shape of the graph by scaling it vertically or horizontally.
Vertical Stretch: , stretches vertically.
Vertical Shrink: , shrinks vertically.
Horizontal Stretch: , stretches horizontally.
Horizontal Shrink: , shrinks horizontally.
Example: The graph below shows vertical stretching and shrinking.
Example: The graph below shows horizontal shrinking.
Example: The graph below shows horizontal stretching.
Example: The graph below shows horizontal stretching with reflection across the y-axis.
Applications of Functions
Functions are used to model real-world situations, such as distance, area, and other quantities.
Example: The distance between two cars moving at right angles can be modeled using the Pythagorean Theorem: .
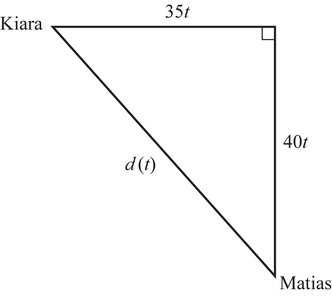
Additional info: The domain of this function is , since time cannot be negative.
