 Indietro
Types of Functions and Their Rates of Change: College Algebra Study Guide
Guida di studio - Note intelligenti
 Appunti personalizzati basati sui tuoi materiali, ampliati con definizioni chiave, esempi e contesto.
Types of Functions and Their Rates of Change
Linear Functions
Linear functions are fundamental in algebra and are characterized by a constant rate of change. They are represented by the equation , where m is the slope and b is the y-intercept.
Definition: A linear function is any function of the form .
Graph: The graph of a linear function is always a straight line.
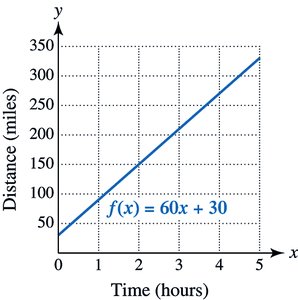
Example: A car traveling north at 60 miles per hour, starting 30 miles north of the Texas border, is modeled by .
Rate of Change and Slope
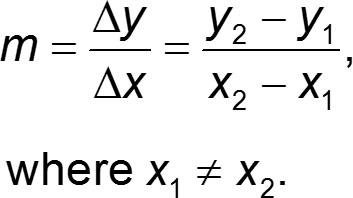
The rate of change in a linear function is constant and is equal to the slope of the line. The slope measures how much the function's output changes for each unit increase in the input.
Formula: The slope between two points and is given by:
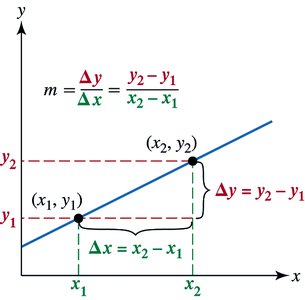
Interpretation: If , the function increases; if , it decreases; if , the function is constant.
Types of Slope
The slope of a line can be positive, negative, zero, or undefined, each with distinct graphical characteristics.
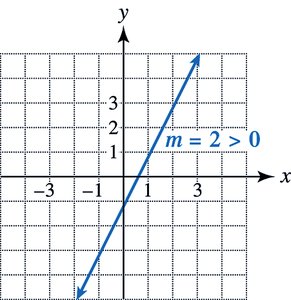
Positive Slope: The line rises from left to right. Example: .
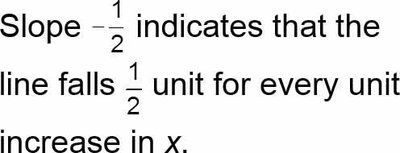
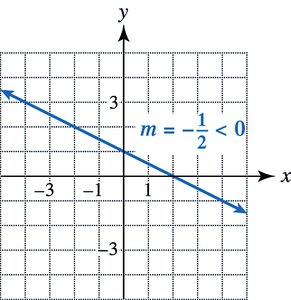
Negative Slope: The line falls from left to right. Example: .
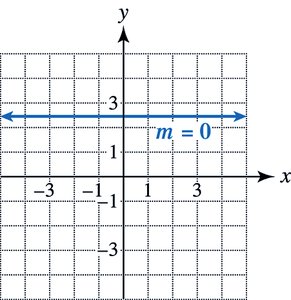
Zero Slope: The line is horizontal.
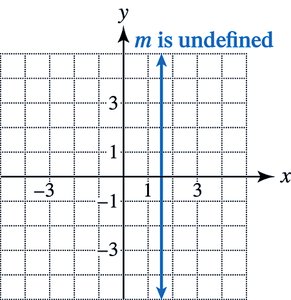
Undefined Slope: The line is vertical.
Calculating Slope from Two Points
To find the slope of a line given two points, use the slope formula. The sign and value of the slope indicate the direction and steepness of the line.
Example: Find the slope between and :
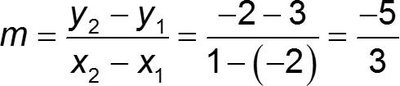

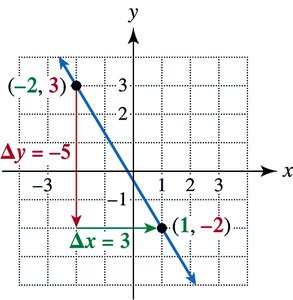
Interpretation: The slope means the line falls $5 units increase in .
Zero of a Function
A zero of a function is a value such that . This is where the graph crosses the x-axis.
Definition: Any number for which is called a zero of the function .
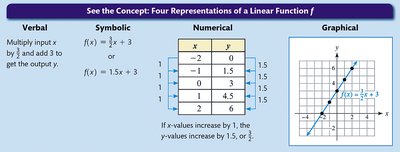
Four Representations of a Linear Function
Linear functions can be represented in four ways: verbal, symbolic, numerical, and graphical. Understanding all forms is essential for interpreting and solving algebraic problems.
Verbal: Describes the relationship in words.
Symbolic: Uses equations, e.g., .
Numerical: Shows input-output pairs in a table.
Graphical: Plots the function on a coordinate plane.
Characteristics of Linear Functions
Linear functions have several defining properties:
Graph is a straight line.
Can be written as .
Has a constant rate of change, equal to .
Has exactly one zero if .
Nonlinear Functions
Definition and Characteristics
Nonlinear functions do not have a constant rate of change and their graphs are not straight lines. They can have any number of zeros and cannot be written in the form .
Graph is not a straight line.
Rate of change is not constant.
Can have multiple zeros.
Common Nonlinear Functions
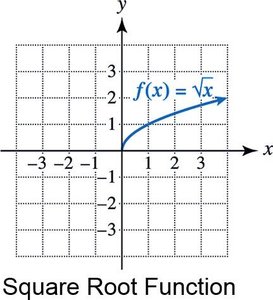
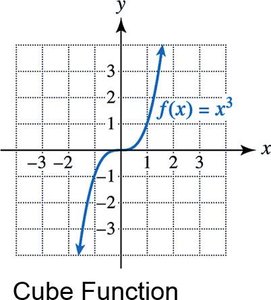
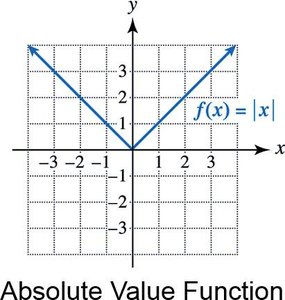
Examples of nonlinear functions include quadratic, square root, cubic, and absolute value functions.
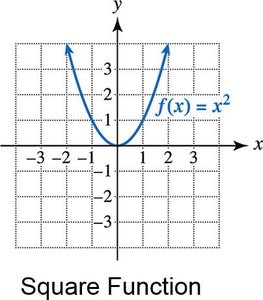
Square Function:
Square Root Function:
Cube Function:
Absolute Value Function:
Increasing and Decreasing Functions
Definitions
A function is said to be increasing on an interval if its output rises as the input increases, and decreasing if its output falls as the input increases.
Increasing: For , .
Decreasing: For , .
Examples and Applications
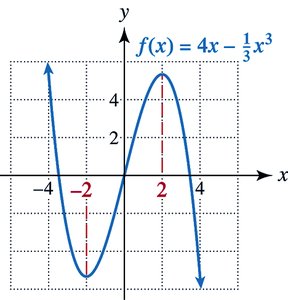
Graphs can illustrate where functions are increasing or decreasing. Interval notation is used to specify these regions.
Example: The function is decreasing on and increasing on .
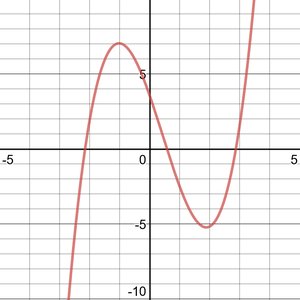
Visualizing Increasing and Decreasing Functions
Graphs and real-world examples, such as sales data, can help visualize these concepts.
Example: Rock music sales decreased from 1990 to 2001 and increased from 2001 to 2006.
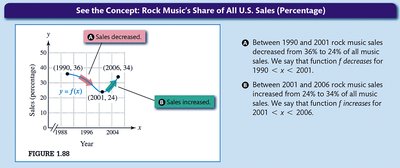
General Illustration: Graphs show uphill (increasing), downhill (decreasing), and mixed behavior.
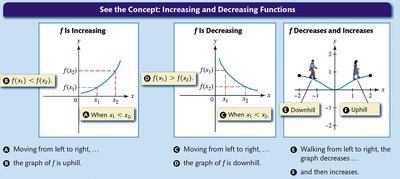
Additional info: All explanations are expanded for clarity and completeness, suitable for college-level algebra study.
