Indietro
Visualizing and Graphing Data: Foundations for College Algebra
Guida di studio - Note intelligenti
 Appunti personalizzati basati sui tuoi materiali, ampliati con definizioni chiave, esempi e contesto.
Visualizing and Graphing Data
Analyzing One-Variable Data
Understanding one-variable data is fundamental in algebra, as it allows us to summarize and interpret numerical information. Common measures include the mean and median, which describe the central tendency of a data set.
Mean: The mean (average) is calculated by summing all values and dividing by the number of values.
Median: The median is the middle value when the data is ordered. If there is an even number of values, it is the average of the two middle values.
Maximum and Minimum: The maximum is the largest value; the minimum is the smallest.
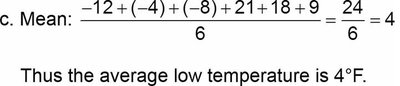
Example: Consider the low temperatures in Minneapolis for six nights: -12, -4, -8, 21, 18, 9.
Mean: Thus, the average low temperature is 4°F.
Median: Ordered list: -12, -8, -4, 9, 18, 21. Median is the average of -4 and 9: This means half the temperatures are above 2.5°F and half are below.

Finding the Domain and Range of a Relation
A relation is a set of ordered pairs (x, y). The domain is the set of all x-values, and the range is the set of all y-values. These concepts are essential for understanding functions and their graphs.
Example: S = {(20, 1.2), (20, 1.1), (40, 1.5), (40, 1.6)} Domain: {20, 40} Range: {1.1, 1.2, 1.5, 1.6}
Graphing in the xy-plane
Cartesian (Rectangular) Coordinate Plane
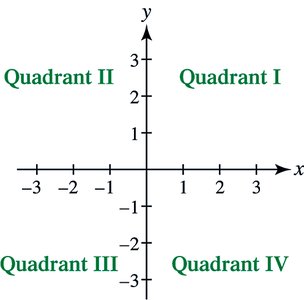
The xy-plane is a two-dimensional space defined by a horizontal x-axis and a vertical y-axis. The axes intersect at the origin (0,0), dividing the plane into four quadrants numbered I, II, III, IV counterclockwise.
Quadrant I: x > 0, y > 0
Quadrant II: x < 0, y > 0
Quadrant III: x < 0, y < 0
Quadrant IV: x > 0, y < 0
Plotting Points in the xy-plane
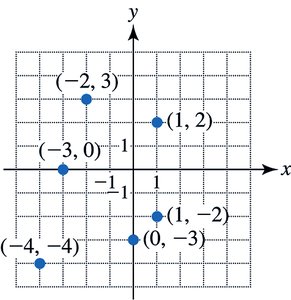
Each point in the xy-plane is represented by an ordered pair (x, y). To plot a point, move x units along the x-axis and y units along the y-axis.
Graphing a Relation as a Scatterplot
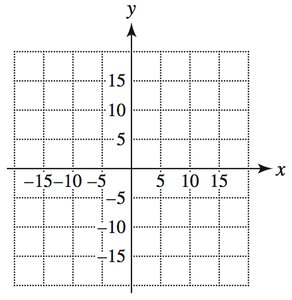
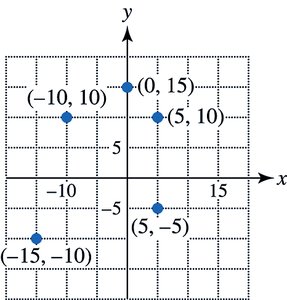
A scatterplot is a graph where distinct points are plotted to represent a relation. Appropriate scales must be chosen for the axes to accurately display the data.
Example: S = {(5, 10), (5, −5), (−10, 10), (0, 15), (−15, −10)} Domain: {−15, −10, 0, 5} Range: {−10, −5, 10, 15} Minimum and maximum values help determine the scale.
Line Graphs
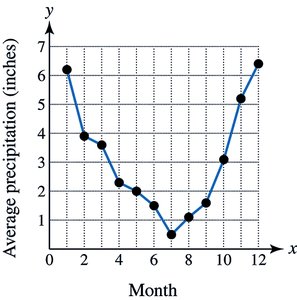
A line graph connects consecutive data points in a scatterplot with straight-line segments, often used to show trends over time.
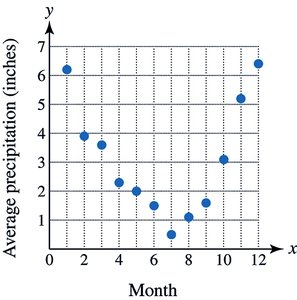
Example: Average monthly precipitation in Portland, Oregon.
Calculating Distance and Midpoint
Distance Formula
The distance formula calculates the distance between two points (x1, y1) and (x2, y2) in the xy-plane, derived from the Pythagorean theorem:
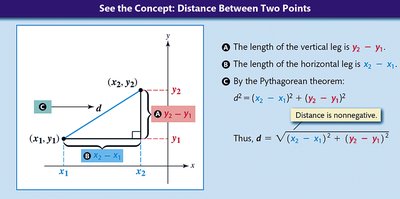
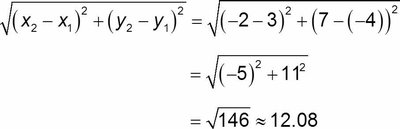
Example: Find the distance between (3, −4) and (−2, 7):
Midpoint Formula
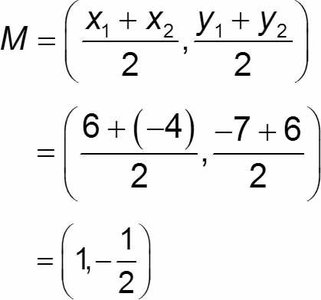
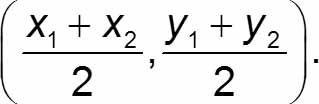
The midpoint formula finds the point exactly halfway between two points (x1, y1) and (x2, y2):
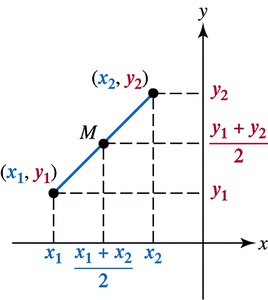
Example: Find the midpoint between (6, −7) and (−4, 6):