Solve each polynomial inequality in Exercises 1–42 and graph the solution set on a real number line. Express each solution set in interval notation.
Ch. 3 - Polynomial and Rational Functions

Capitolo 4, Problema 17
In Exercises 15–18, use the Leading Coefficient Test to determine the end behavior of the graph of the given polynomial function. Then use this end behavior to match the polynomial function with its graph. [The graphs are labeled (a) through (d).] <IMAGE>
Guida verificata passo dopo passo1
Identify the degree of the polynomial function. Since the function is \(f(x) = (x - 3)^2\), expand or recognize that the degree is 2 because the expression is squared.
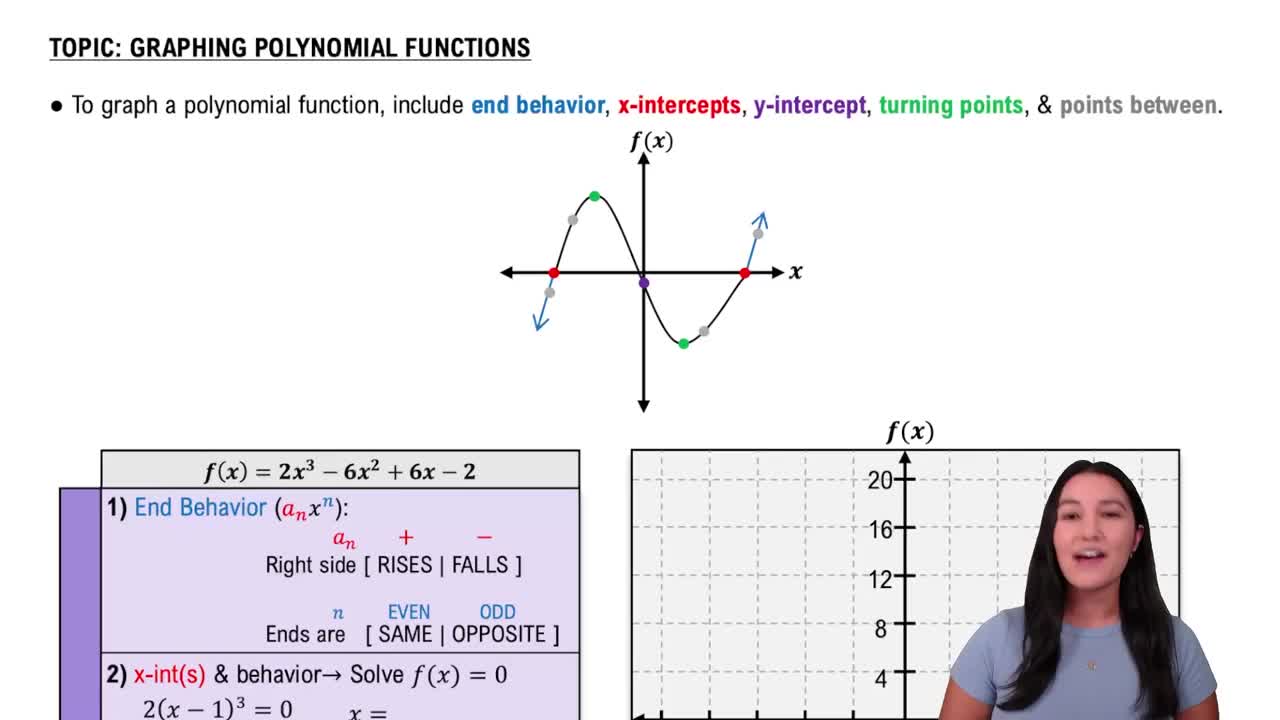
Determine the leading coefficient. When expanded, the leading term is \(x^2\), so the leading coefficient is 1, which is positive.
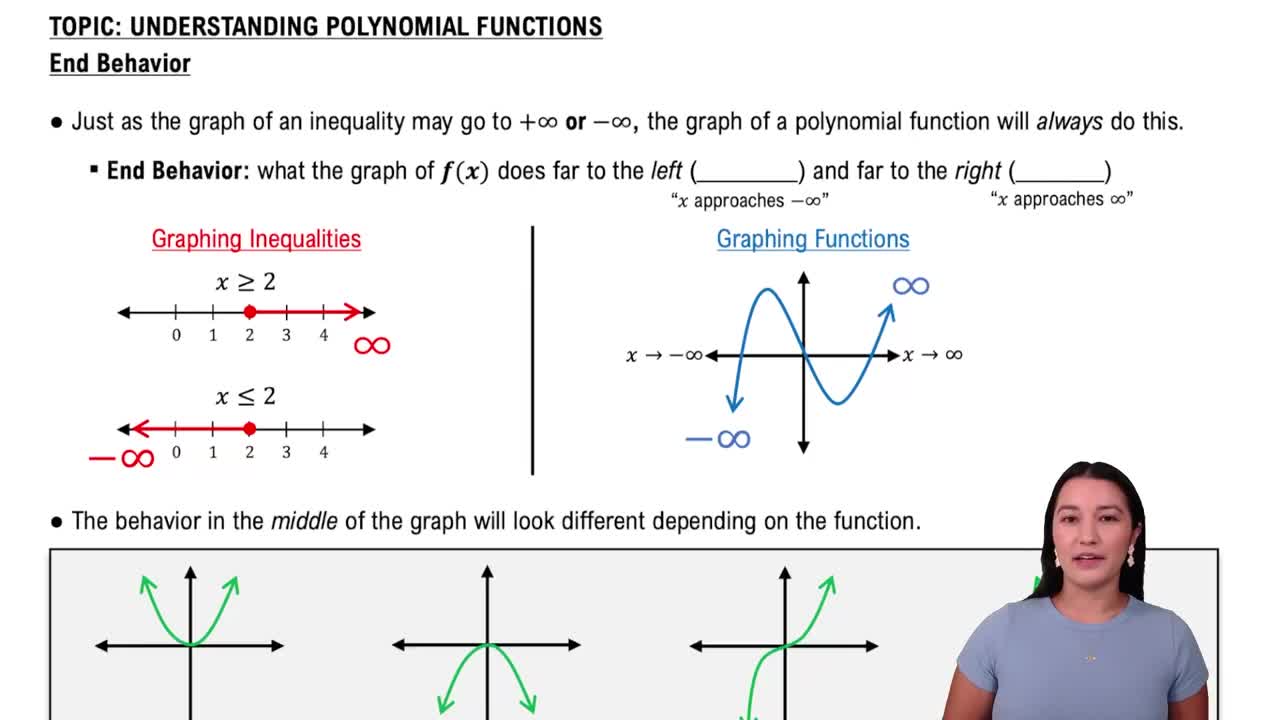
Apply the Leading Coefficient Test: For an even degree polynomial with a positive leading coefficient, the end behavior is that as \(x \to \infty\), \(f(x) \to \infty\), and as \(x \to -\infty\), \(f(x) \to \infty\).
Use this end behavior to match the polynomial with the correct graph. Look for a graph where both ends rise upwards, consistent with the behavior of a positive leading coefficient and even degree.
Confirm that the graph also reflects the vertex at \(x=3\), since the function is \((x-3)^2\), which shifts the parabola to the right by 3 units.

Risposta video verificata per un problema simile:
Questa soluzione video è stata consigliata dai nostri tutor come utile per risolvere questo problema.
Durata del video:
3mConcetti chiave
Ecco i concetti essenziali che devi comprendere per rispondere correttamente alla domanda.
Leading Coefficient Test
The Leading Coefficient Test helps determine the end behavior of a polynomial function by examining the degree and the leading coefficient. For large positive or negative values of x, the sign and degree dictate whether the graph rises or falls on each end.
Video consigliato:
End Behavior of Polynomial Functions
Polynomial Degree and Its Effect on Graph Shape
The degree of a polynomial indicates the highest power of x and influences the number of turning points and the general shape of the graph. Even-degree polynomials have similar end behaviors on both sides, while odd-degree polynomials have opposite end behaviors.
Video consigliato:
Graphing Polynomial Functions
End Behavior of Polynomial Functions
End behavior describes how the values of a polynomial function behave as x approaches positive or negative infinity. Understanding this helps match the function to its graph by predicting whether the graph rises or falls at the extremes.
Video consigliato:
End Behavior of Polynomial Functions
Pratica correlata
Domanda del libro di testo
498
views
Domanda del libro di testo
Write an equation that expresses each relationship. Then solve the equation for y. x varies jointly as y and z and inversely as the square of w.
549
views
Domanda del libro di testo
In Exercises 17–24, a) List all possible rational roots. b) List all possible rational roots. c) Use the quotient from part (b) to find the remaining roots and solve the equation. x3−2x2−11x+12=0
561
views
Domanda del libro di testo
Write an equation that expresses each relationship. Then solve the equation for y. x varies jointly as z and the sum of y and w.
532
views
Domanda del libro di testo
Divide using synthetic division. (2x2+x−10)÷(x−2)
550
views
Domanda del libro di testo
Use the graph of the rational function in the figure shown to complete each statement in Exercises 15–20.
As __
1413
views