 Indietro
Building Blocks of Managerial Accounting: Comprehensive Study Notes
Guida di studio - Note intelligenti
 Appunti personalizzati basati sui tuoi materiali, ampliati con definizioni chiave, esempi e contesto.
Building Blocks of Managerial Accounting
Business Sectors: Service, Merchandising, and Manufacturing Companies
Understanding the three main types of business sectors is fundamental in managerial accounting, as each has distinct characteristics and cost structures.
Service Companies: Sell intangible services (e.g., health care, insurance, banking, consulting). Largest sector in the U.S. economy. Generally, do not hold inventory.
Merchandising Companies: Resell tangible products purchased from manufacturers and suppliers (e.g., Walmart, Amazon). Retailers sell directly to consumers; wholesalers sell to other businesses. Carry substantial inventory.
Manufacturing Companies: Use labor, plant, and equipment to convert raw materials into finished products (e.g., Toyota). Maintain three types of inventory:
Raw materials inventory
Work in process inventory
Finished goods inventory
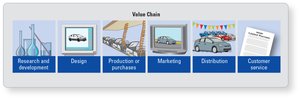
The Value Chain and Its Elements
The value chain encompasses all activities that add value to a company’s products and services, from conception to delivery and after-sales support.
Research and Development (R&D): Creating new or improved products/services and production processes.
Design: Detailed engineering of products/services and production processes.
Production or Purchases: Manufacturing products or purchasing merchandise for resale.
Marketing: Promotion and advertising.
Distribution: Delivery to customers.
Customer Service: Support after the sale.
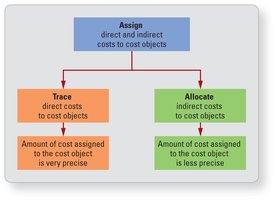
Direct and Indirect Costs
Costs are classified based on their traceability to a cost object, which is anything managers want to know the cost of (e.g., product, department, project).
Direct Costs: Can be traced directly to a cost object (e.g., direct materials for a car model).
Indirect Costs: Cannot be traced specifically to a cost object; shared among several cost objects (e.g., factory rent).
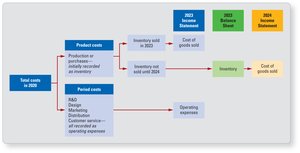
Product Costs and Period Costs
Managerial accounting distinguishes between costs for internal decision-making and external financial reporting.
Total Cost: All resources used throughout the value chain.
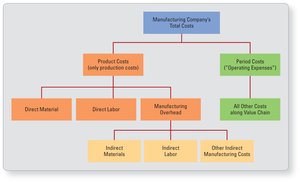
Product Costs: Costs incurred to produce or purchase inventory; treated as inventory until sold (required by GAAP).
Period Costs: Costs not related to inventory; expensed immediately (e.g., operating expenses, selling, general, and administrative expenses).
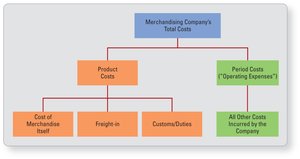
Merchandising Companies’ Total Costs
Product Costs: Cost of merchandise itself, freight-in, customs/duties.
Period Costs: All other costs incurred by the company (operating expenses).
Manufacturing Companies’ Product Costs
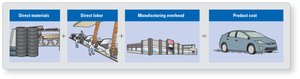
Direct Materials (DM): Primary materials that become part of the finished product.
Direct Labor (DL): Compensation for employees who physically convert raw materials into products.
Manufacturing Overhead (MOH): All manufacturing costs other than DM and DL (includes indirect materials, indirect labor, and other indirect manufacturing costs).
Prime and Conversion Costs
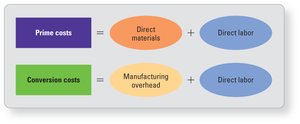
Prime Costs: Direct materials + direct labor
Conversion Costs: Manufacturing overhead + direct labor
Additional Labor Compensation Costs
Salaries and wages
Fringe benefits (health insurance, retirement, payroll taxes, paid vacations)
These can add approximately 35% beyond gross salaries and wages.
Income Statements for Different Company Types
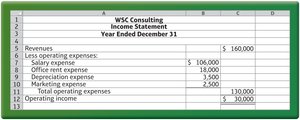
Income statements differ based on the type of company, reflecting their unique cost structures.
Service Company Income Statement
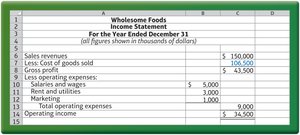
Merchandising Company Income Statement
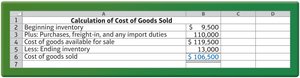
Cost of Goods Sold—Merchandising Company
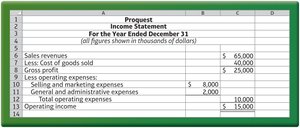
Manufacturing Company Income Statement
Calculating Cost of Goods Sold—Manufacturer
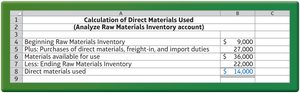
Step 1: Calculate the cost of direct materials used.
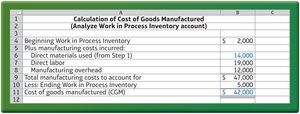
Step 2: Calculate the cost of goods manufactured.
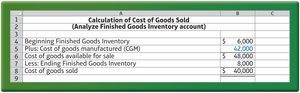
Step 3: Calculate the cost of goods sold.
Balance Sheet Comparison
Service companies: No inventory
Merchandising companies: Inventory or Merchandise Inventory
Manufacturing companies: Raw Materials, Work in Process, Finished Goods Inventory
Relevant and Irrelevant Costs for Decision Making
Decision-making requires distinguishing between costs that can be influenced and those that cannot.
Controllable Costs: Can be influenced or changed by management.
Uncontrollable Costs: Cannot be changed in the short run.
Relevant Costs: Differential costs that differ between alternatives.
Irrelevant Costs: Do not differ among alternatives.
Sunk Costs: Already incurred and cannot be changed.
Fixed and Variable Costs; Total and Average Costs
Cost behavior is essential for planning and decision-making.
Fixed Costs: Remain constant in total over a wide range of activity levels.
Variable Costs: Change in total in direct proportion to changes in volume.
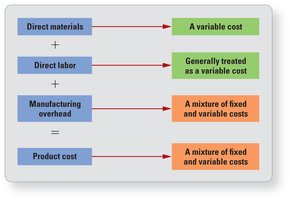
Product Cost Composition:
Direct materials: Variable cost
Direct labor: Generally treated as variable
Manufacturing overhead: Mixture of fixed and variable costs
Product cost: Mixture of fixed and variable costs
Cost Calculations
Total Cost Formula:
Average Cost Formula:
Marginal Cost: Cost of producing one additional unit; fixed costs typically do not change unless at full capacity.
Data Types and Sources in Analytics
Managers use various types of data to analyze revenue, cost, and inventory.
Structured Data: Highly organized, easy to search and manipulate (e.g., sales records).
Unstructured Data: Not organized into predefined categories (e.g., social media posts).
Semi-structured Data: In-between structured and unstructured (e.g., Facebook likes).
Numerical (Quantitative) Data: Measured, counted, or aggregated; can be discrete or continuous.
Categorical (Nominal) Data: No numerical value; cannot be ranked (e.g., country, product type).
Ordinal Data: Has a defined order; mixes numerical and categorical data (e.g., satisfaction rankings).
Excel Tables and Filters for Data Analysis
Excel tables allow managers to efficiently sort and filter data for analysis.
Sorting: Arranging data records in a specific order based on a criterion.
Filtering: Viewing a subset of data based on criteria.
Excel tables are easy to create, sort, and filter, enabling dynamic analysis of revenue, cost, and inventory data.
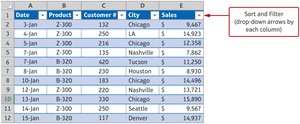
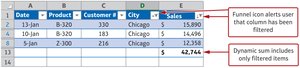
How to Create, Filter, and Sort a Table in Excel
Start with a data set; ensure each column has a descriptive title (e.g., Date, Product, Customer #).
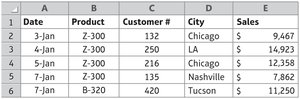
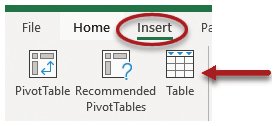
Convert the data set to an Excel table: Click any cell, go to the Insert tab, and click the Table icon.
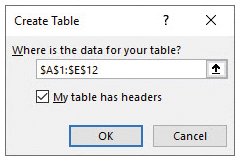
A dialogue box will open; Excel suggests the data range for the table.
Use the drop-down menu next to each column heading to sort and/or filter data according to chosen criteria.
Summary Table: Comparison of Company Types
Company Type | Inventory | Income Statement Feature |
|---|---|---|
Service | None | Operating expenses only |
Merchandising | Inventory | Cost of goods sold, operating expenses |
Manufacturing | Raw materials, WIP, finished goods | Cost of goods sold, operating expenses |
Key Formulas
Cost of Goods Sold (Merchandising):
Direct Materials Used:
Cost of Goods Manufactured:
Cost of Goods Sold (Manufacturing):
Conclusion
Managerial accounting provides essential tools for understanding cost structures, preparing financial statements, and making informed decisions. Mastery of these concepts enables managers to analyze operations, control costs, and improve profitability.
