 Indietro
Phase Equilibria and Vapor-Liquid Equilibrium (VLE) in General Chemistry
Guida di studio - Note intelligenti
 Appunti personalizzati basati sui tuoi materiali, ampliati con definizioni chiave, esempi e contesto.
Phase Diagrams and Phase Equilibria
Understanding Phase Diagrams
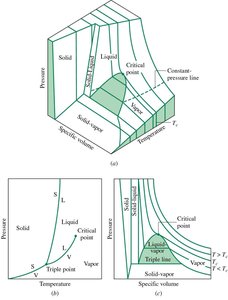
Phase diagrams are graphical representations that show the stability of phases (solid, liquid, vapor) of a substance as a function of variables such as temperature, pressure, and composition. They are essential for predicting the conditions under which different phases coexist in equilibrium.
Triple Point: The unique set of conditions where all three phases coexist in equilibrium.
Critical Point: The end point of the phase equilibrium curve between liquid and vapor, beyond which the two phases become indistinguishable.
Phase Boundaries: Lines or surfaces separating different phase regions, indicating equilibrium between those phases.
Phase diagrams can be represented in various forms:
P-T (Pressure-Temperature) Diagram: Shows regions of stability for each phase and the lines of equilibrium between them.
P-V (Pressure-Volume) and T-V (Temperature-Volume) Diagrams: Useful for visualizing phase transitions and critical behavior.
Vapor-Liquid Equilibrium (VLE) in Binary Mixtures
Three-Dimensional VLE Diagrams
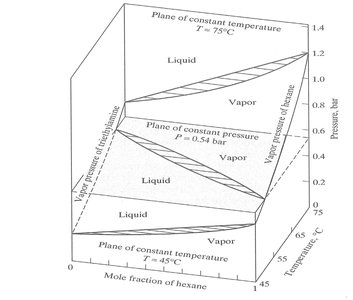
For binary mixtures, phase behavior is more complex due to the presence of two components. The P-T-x-y (Pressure-Temperature-composition) diagram is a three-dimensional representation that shows the regions of vapor, liquid, and two-phase coexistence as a function of temperature, pressure, and composition.
Planes of Constant Temperature or Pressure: Slices through the 3D diagram at fixed temperature or pressure reveal the phase boundaries and regions of single or two-phase stability.
Vapor and Liquid Regions: The diagram helps identify the conditions under which the mixture is entirely vapor, entirely liquid, or a mixture of both.
Generalized VLE Surface: P-T-x-y Diagram
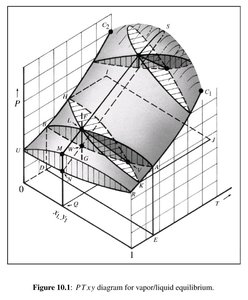
The P-T-x-y diagram for vapor/liquid equilibrium (VLE) is a more abstract but powerful tool for visualizing the equilibrium between vapor and liquid phases in binary mixtures. It shows how the equilibrium compositions of vapor and liquid phases change with temperature and pressure.
Bubble Point: The condition at which the first bubble of vapor forms from a liquid mixture upon heating or reducing pressure.
Dew Point: The condition at which the first drop of liquid condenses from a vapor mixture upon cooling or increasing pressure.
Tie Lines: Lines connecting equilibrium vapor and liquid compositions at a given temperature and pressure.
VLE Data and K-Value Charts
K-Values and Their Use in VLE Calculations
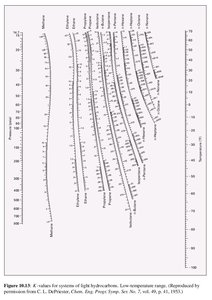
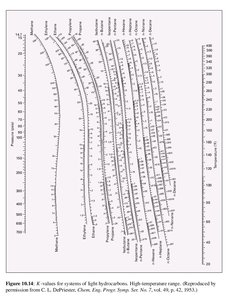
The K-value (or equilibrium ratio) is defined as the ratio of the mole fraction of a component in the vapor phase to that in the liquid phase at equilibrium: Ki = yi / xi. K-values are crucial for flash calculations, distillation, and other separation processes.
K-values depend on temperature, pressure, and composition.
Charts such as the DePriester charts provide K-values for various hydrocarbons over a range of conditions.
VLE Diagrams for Binary Mixtures: x-y and P-x-y Plots
x-y Diagrams
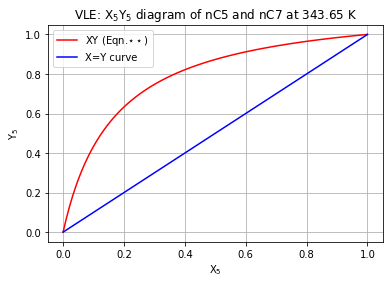
The x-y diagram plots the equilibrium mole fraction of a component in the liquid phase (x) versus that in the vapor phase (y) at constant temperature or pressure. It is used to visualize the enrichment of the vapor phase in the more volatile component and is fundamental for distillation design.
The curve shows the deviation from the ideal (x = y) line, indicating the relative volatility.
P-x-y Diagrams
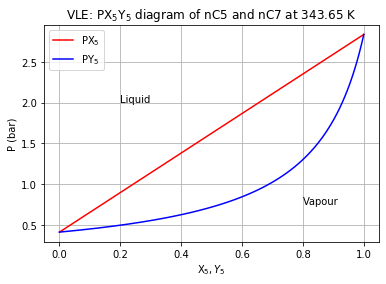
The P-x-y diagram shows the equilibrium pressure as a function of the liquid and vapor compositions at constant temperature. It is used to determine bubble and dew points and to identify the regions of single-phase and two-phase behavior.
The area between the curves represents the two-phase region (liquid-vapor coexistence).
Summary Table: Key VLE Concepts
Term | Definition |
|---|---|
Bubble Point | First appearance of vapor in a liquid mixture upon heating or depressurization |
Dew Point | First appearance of liquid in a vapor mixture upon cooling or pressurization |
Tie Line | Connects equilibrium vapor and liquid compositions at a given T and P |
K-Value | Equilibrium ratio: Ki = yi / xi |
Phase Envelope | Region in a diagram where two phases coexist |
Additional info:
Phase diagrams and VLE concepts are foundational for understanding distillation, extraction, and other separation processes in chemical engineering and general chemistry.
Mastery of reading and interpreting these diagrams is essential for predicting phase behavior and designing separation equipment.
