 Indietro
Genetics Exam 1 Review: Chromosomes, Pedigrees, Probabilities, and Bacterial Genetics
Guida di studio - Note intelligenti
 Appunti personalizzati basati sui tuoi materiali, ampliati con definizioni chiave, esempi e contesto.
Chromosomes and Chromatids
Chromosome and Chromatid Counting
Understanding chromosome and chromatid numbers is fundamental in genetics, especially when analyzing cell division processes such as mitosis and meiosis.
Haploid (1n): A cell with one set of chromosomes. Example: If 1n = 12, then the diploid number (2n) is 24.
Diploid (2n): A cell with two sets of chromosomes.
Chromosome Number: Determined by counting centromeres.
Chromatid Number: Determined by counting the arms of chromosomes (each chromosome in X form has two chromatids).
Chromatids in Mitosis
During metaphase of mitosis in a diploid cell (1n = 6):
Diploid means 2n = 12 chromosomes.
In metaphase, chromosomes are in X form, so there are 24 chromatids.
Chromatids in Meiosis
Meiosis involves two divisions, resulting in haploid cells.
Start: Diploid cell (2n = 12 chromosomes, 24 chromatids).
After Meiosis I: Chromosome number halves (1n = 6 chromosomes, 12 chromatids).
After Meiosis II: Each cell has 6 chromosomes and 6 chromatids.
Pedigree Analysis
Identifying Inheritance Patterns
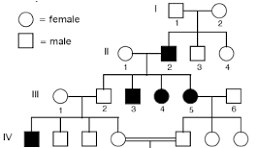
Pedigrees are diagrams that show the inheritance of traits across generations. They are used to determine whether traits are autosomal or sex-linked, and dominant or recessive.
Autosomal Recessive: Affected children can have unaffected parents.
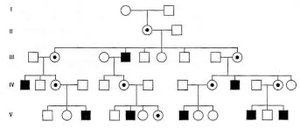
X-linked Recessive: More males are affected; trait is often passed through females.
Incomplete Penetrance: Not all individuals with the genotype express the phenotype.
Example: Pedigree Analysis
Look for affected children with unaffected parents to identify recessive inheritance. X-linked recessive traits often show more affected males and are transmitted through carrier females.
Punnett Squares and Probability
X-linked Punnett Squares
Punnett squares are used to predict the outcome of genetic crosses. X-linked crosses require careful attention to sex chromosomes.
RR x rr: All offspring are Rr.
XRXR x XrY: All offspring show dominant phenotype.
Test Cross: Female test cross yields half males with recessive phenotype; male test cross yields all males recessive, all females dominant.
XrXr x XRY: All males are recessive, all females dominant.
Dihybrid Punnett Squares
Dihybrid crosses involve two genes and can be analyzed using Punnett squares.
Dihybrid TtPp x TtPp: Ratio is 9:3:3:1.
Dihybrid test cross TtPp x ttpp: Ratio is 1:1:1:1.
Monohybrid Tt x Tt: Ratio is 3:1.
Monohybrid Tt x tt: Ratio is 1:1.
Probability Calculations
Probability in genetics can be calculated using sum, product, and binomial rules.
SUM Rule: For mutually exclusive events.
PRODUCT Rule: For sequential events (e.g., first tall, then short).
BINOMIAL Rule: For unordered events (e.g., 4 out of 7).
Binomial Example: Cat Coat Patterns
Cross: Tt x Tt (mackerel tabby dominant, classic tabby recessive)
Expected: 75% mackerel, 25% classic.
Probability of 5 out of 8 classic tabby kittens:
Use the binomial formula:
n = 8, x = 5, p = 0.25 (classic), q = 0.75 (mackerel)
Chi Square Analysis
Chi Square Test
The chi square test is used to compare observed and expected results in genetic crosses.
Expected: Theoretical ratio from Punnett square.
Observed: Actual data from experiment.
Chi square formula:
O = observed value
E = expected value
Chromosome Mapping
Test Cross and Recombination Frequency
Chromosome mapping in eukaryotes uses test crosses to determine recombination frequency.
Test Cross: Ratio is 1:1:1:1.
Parentals: Offspring with parental genotype.
Nonparentals: Offspring with recombinant genotype.
Recombination Frequency:
Map Units (cM): 1% recombination = 1 cM.
Alternative equation:
Extensions of Mendelian Genetics
Lethal Alleles and Epistasis
Extensions include lethal alleles and gene interactions such as epistasis.
Lethal Alleles: Can result in a 2:1 ratio in offspring.
Epistasis: Interaction between two genes affects phenotype.
Complementation Groups
Gene Complementation
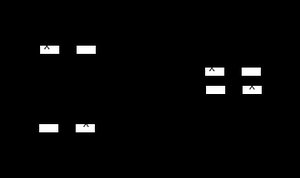
Complementation tests determine whether mutations are in the same gene or different genes.
Same gene: Mutations do not complement.
Different gene: Mutations complement.
Bacterial Genetics
Bacterial Conjugation
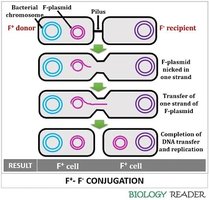
Bacterial conjugation is a process of genetic exchange involving F factors.
F+: Donor cell with fertility plasmid.
F-: Recipient cell without plasmid.
Hfr: High frequency recombination cell.
F': Cell with F plasmid carrying additional genes.
Merozygote: Partial diploid cell formed during conjugation.
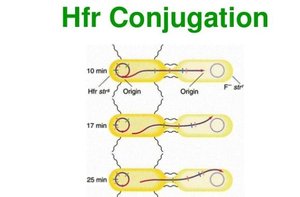
Hfr Conjugation
Hfr cells transfer chromosomal genes to F- cells during conjugation, allowing mapping of bacterial genes.
Viral Life Cycles
Bacteriophage Genetics
Bacteriophages are viruses that infect bacteria and are used in genetic mapping and analysis.
Lytic Cycle: Virus replicates and lyses host cell.
Lysogenic Cycle: Viral DNA integrates into host genome.
Additional info: Viral life cycles are important for understanding genetic exchange and mapping in bacteria.
----------------------------------------
