 Indietro
Step-by-Step Guidance for CHEM:1070 General Chemistry I Sample Exam 1
Guida di studio - Note intelligenti
 Appunti personalizzati basati sui tuoi materiali, ampliati con definizioni chiave, esempi e contesto.
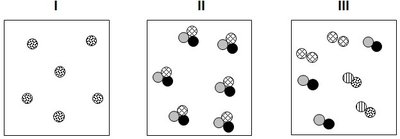
Q8. Which of the following diagrams represent(s) a pure substance?
Background
Topic: Classification of Matter (Pure Substances vs. Mixtures)
This question tests your ability to distinguish between pure substances and mixtures based on particle diagrams.
Key Terms:
Pure Substance: A material made of only one type of particle (element or compound), with a uniform composition throughout.
Mixture: A material made of two or more different types of particles, which can be elements or compounds, not chemically combined.
Step-by-Step Guidance
Examine each diagram (I, II, III) and identify the types of particles present in each box.
For diagram I, observe whether all particles are identical or if there are different types present.
For diagram II, check if there are two or more types of particles (for example, different colors or shapes) and whether they are combined or separate.
For diagram III, look for the presence of multiple types of particles and whether they are mixed or uniform.
Recall: A pure substance will have only one type of particle throughout the diagram, while a mixture will show more than one type.
Based on your observations, determine which diagrams show only one type of particle (pure substance) and which show a combination (mixture).
Try solving on your own before revealing the answer!
Final Answer: Diagrams II and III only
Diagram I shows only one type of particle, indicating a pure substance. Diagrams II and III show more than one type of particle, indicating mixtures. Therefore, the correct answer is II and III only.
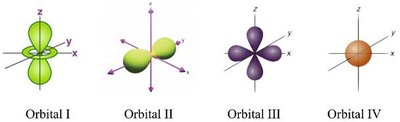
Q19. Which of the following four atomic orbitals corresponds to a d orbital?
Background
Topic: Atomic Orbitals and Electron Configuration
This question tests your ability to recognize the shapes and types of atomic orbitals, specifically identifying d orbitals among s and p orbitals.
Key Terms:
Atomic Orbital: A region in an atom where there is a high probability of finding electrons.
s orbital: Spherical shape.
p orbital: Dumbbell shape.
d orbital: Cloverleaf or complex shape, typically with four lobes.
Step-by-Step Guidance
Review the visual representations of Orbitals I, II, III, and IV.
Recall the typical shapes: s (spherical), p (dumbbell), d (cloverleaf/four lobes).
Compare each orbital's shape to the descriptions above.
Identify which orbitals have the characteristic four-lobed (cloverleaf) shape of d orbitals.
Note which orbitals are not d orbitals based on their shape.
Try solving on your own before revealing the answer!
Final Answer: Orbitals III and IV
Orbitals III and IV display the characteristic shapes of d orbitals (cloverleaf and complex shapes), so these are the correct answers.
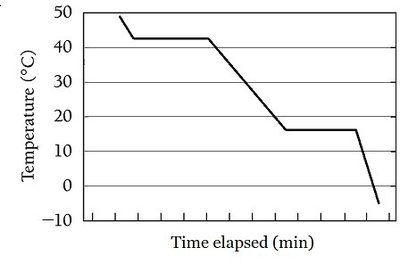
Q26. On the graph, what is the temperature at 40 minutes?
Background
Topic: Reading and Interpreting Temperature-Time Graphs
This question tests your ability to read a cooling curve and determine the temperature at a specific time point.
Key Terms:
Cooling Curve: A graph showing how temperature changes over time as a substance cools.
Temperature: The y-axis value, measured in degrees Celsius (°C).
Time Elapsed: The x-axis value, measured in minutes.
Step-by-Step Guidance
Locate the 40-minute mark on the x-axis of the graph.
Draw a vertical line from the 40-minute mark up to the curve.
From the intersection point, draw a horizontal line to the y-axis to find the corresponding temperature.
Read the value on the y-axis where your horizontal line meets.
Try solving on your own before revealing the answer!
Final Answer: 26 °C
At 40 minutes, the graph shows the temperature is 26 °C. This is determined by following the steps above and reading the value from the y-axis.
