 Indietro
Chapter 3: Where Prices Come From – The Interaction of Demand and Supply
Guida di studio - Note intelligenti
 Appunti personalizzati basati sui tuoi materiali, ampliati con definizioni chiave, esempi e contesto.
Where Prices Come From: The Interaction of Demand and Supply
Introduction
This chapter explores how prices are determined in markets through the interaction of demand and supply. It introduces the concepts of demand and supply curves, market equilibrium, and the effects of shifts in these curves on equilibrium price and quantity. The analysis is based on the model of a perfectly competitive market, which, despite its restrictive assumptions, provides valuable insights into real-world markets.
The Demand Side of the Market
Market Demand and the Law of Demand
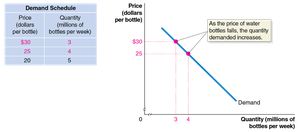
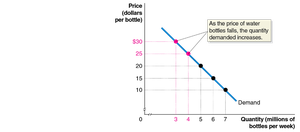
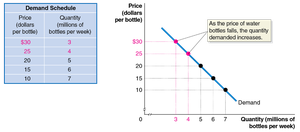
Market demand refers to the total demand by all consumers for a given good or service. The law of demand states that, holding everything else constant, when the price of a product falls, the quantity demanded increases, and when the price rises, the quantity demanded decreases.
Demand schedule: A table showing the relationship between the price of a product and the quantity demanded.
Demand curve: A graphical representation of the demand schedule, showing the relationship between price and quantity demanded.
Quantity demanded: The amount of a good or service that a consumer is willing and able to purchase at a given price.
Explaining the Law of Demand: Substitution and Income Effects
Substitution effect: When the price of a good falls, consumers substitute toward the cheaper good, increasing quantity demanded.
Income effect: A lower price increases consumers' purchasing power, allowing them to buy more.
These effects explain why the demand curve slopes downward.
Ceteris Paribus and Shifts in Demand
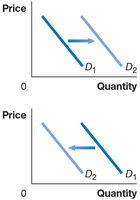
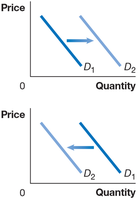
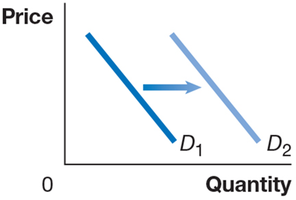
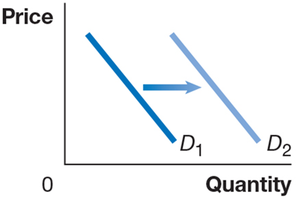
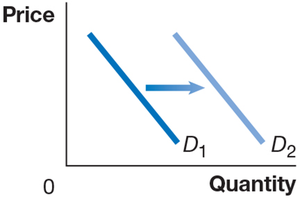
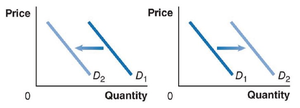
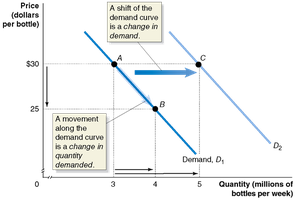
When analyzing demand, we use the ceteris paribus ("all else equal") condition, holding other variables constant to isolate the effect of price changes. A change in price causes a movement along the demand curve (change in quantity demanded), while changes in other factors shift the entire demand curve (change in demand).
Variables That Shift Market Demand
Income: Increases demand for normal goods, decreases demand for inferior goods.
Prices of related goods: Substitutes and complements affect demand differently.
Tastes: Changes in consumer preferences can increase or decrease demand.
Population and demographics: More buyers increase demand.
Expected future prices: Expectations of higher future prices increase current demand.
Natural disasters and pandemics: Can temporarily disrupt demand for certain goods.
Normal and Inferior Goods
Normal good: Demand increases as income rises (e.g., new clothes, vacations).
Inferior good: Demand increases as income falls (e.g., instant noodles, second-hand clothes).
Substitutes and Complements
Substitutes: Goods used for the same purpose (e.g., Big Mac and Whopper).
Complements: Goods used together (e.g., left and right shoes).
Change in Demand vs. Change in Quantity Demanded
A change in the price of the product causes a movement along the demand curve (change in quantity demanded). Any other change affecting demand shifts the entire demand curve (change in demand).
The Supply Side of the Market
Market Supply and the Law of Supply
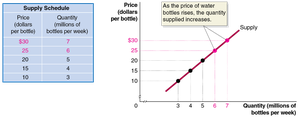
Market supply refers to the total amount of a good or service that firms are willing and able to sell at various prices. The law of supply states that, holding everything else constant, increases in price cause increases in the quantity supplied, and decreases in price cause decreases in the quantity supplied.
Supply schedule: A table showing the relationship between the price of a product and the quantity supplied.
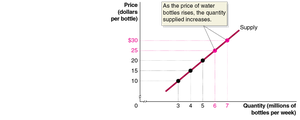
Supply curve: A graphical representation of the supply schedule.
Quantity supplied: The amount of a good or service that a firm is willing and able to supply at a given price.
Shifts in the Supply Curve
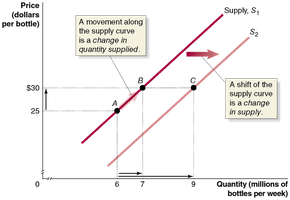
A change in something other than price that affects supply causes the entire supply curve to shift. A shift to the right is an increase in supply; a shift to the left is a decrease in supply.
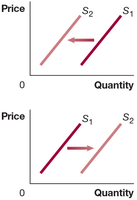
Variables That Shift Market Supply
Prices of inputs: Higher input prices decrease supply; lower input prices increase supply.
Technological change: Improvements increase supply; restrictions decrease supply.
Prices of related goods in production: Substitutes and complements in production affect supply decisions.
Number of firms: More firms increase supply.
Expected future prices: Anticipation of higher future prices may decrease current supply.
Natural disasters and pandemics: Disruptions decrease supply.
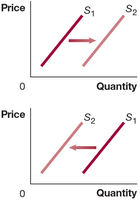
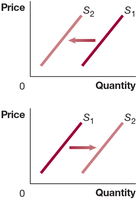
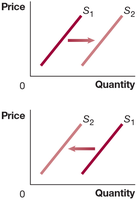
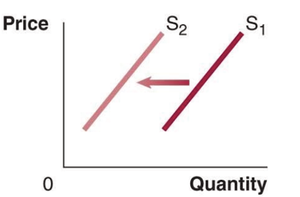
Change in Supply vs. Change in Quantity Supplied
A change in the price of the product causes a movement along the supply curve (change in quantity supplied). Any other change affecting supply shifts the entire supply curve (change in supply).
Market Equilibrium: Putting Demand and Supply Together
Market Equilibrium
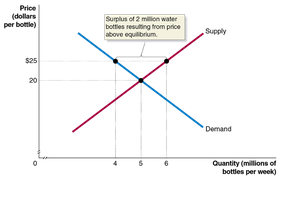
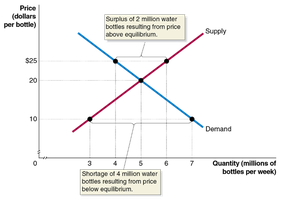
Market equilibrium occurs when quantity demanded equals quantity supplied. In a perfectly competitive market, this is called a competitive market equilibrium. The equilibrium price is the price at which buyers and sellers agree to trade, and the equilibrium quantity is the amount traded at that price.
If the price is above equilibrium, a surplus occurs (quantity supplied > quantity demanded), causing price to fall.
If the price is below equilibrium, a shortage occurs (quantity demanded > quantity supplied), causing price to rise.
The Effect of Demand and Supply Shifts on Equilibrium
Predicting Changes in Price and Quantity
Shifts in demand or supply curves change the equilibrium price and quantity. The direction of these changes depends on which curve shifts and by how much.
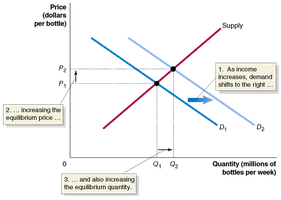
Increase in demand: Equilibrium price and quantity both rise.
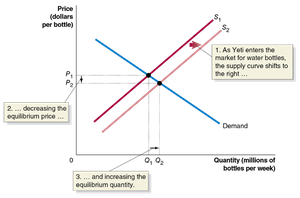
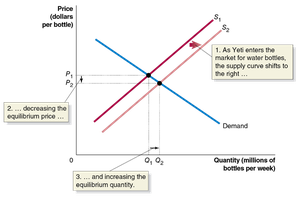
Increase in supply: Equilibrium price falls, equilibrium quantity rises.
Simultaneous shifts: If both demand and supply increase, equilibrium quantity rises, but the effect on price depends on the relative size of the shifts.
Summary Table: Effects of Shifts in Demand and Supply
Change | Equilibrium Price | Equilibrium Quantity |
|---|---|---|
Increase in demand | Rises | Rises |
Decrease in demand | Falls | Falls |
Increase in supply | Falls | Rises |
Decrease in supply | Rises | Falls |
Both increase | Ambiguous | Rises |
Both decrease | Ambiguous | Falls |
Additional info: The effect on equilibrium price when both demand and supply shift depends on the magnitude of each shift.
Movements Along vs. Shifts of Curves
A movement along a curve is caused by a change in the good's own price. A shift of the curve is caused by changes in other determinants (income, tastes, input prices, etc.). For example, an increase in supply causes a movement along the demand curve, not a shift in demand.
Key Equations
Demand function (linear):
Supply function (linear):
Equilibrium condition:
Where is quantity demanded, is quantity supplied, is price, and are constants.
