 Indietro
Chapter 8: GDP—Measuring Total Production and Income (Macroeconomics Study Notes)
Guida di studio - Note intelligenti
 Appunti personalizzati basati sui tuoi materiali, ampliati con definizioni chiave, esempi e contesto.
Microeconomics and Macroeconomics
Definitions and Scope
Economics is divided into two main branches: microeconomics and macroeconomics. Microeconomics focuses on the choices of households and firms, their interactions in markets, and the influence of government policies. In contrast, macroeconomics studies the economy as a whole, including broad phenomena such as inflation, unemployment, and economic growth.
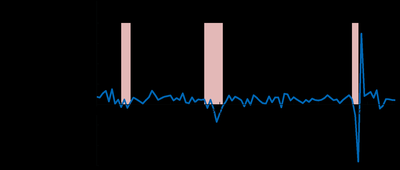
Business cycle: Alternating periods of economic expansion and recession.
Expansion: Period when total production and employment are increasing.
Recession: Period when total production and employment are decreasing.
Economic growth: The ability of an economy to produce increasing quantities of goods and services.
Inflation rate: The percentage increase in the price level from one year to the next.
The Market System: Circular Flow
Participants and Markets
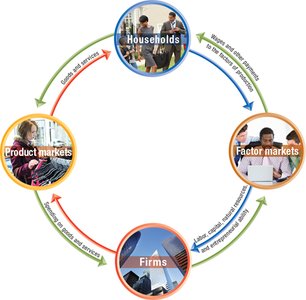
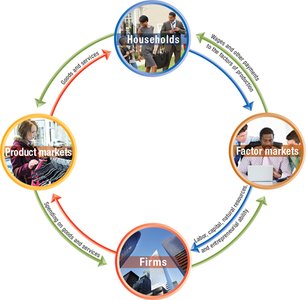
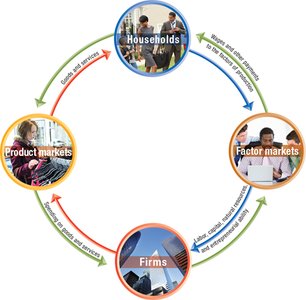
The market system is composed of households and firms interacting in two main types of markets: factor markets and product markets. Households provide factors of production (labor, capital, natural resources, and entrepreneurial ability), while firms use these factors to produce goods and services.
Labor: All types of work, from part-time jobs to senior management.
Capital: Physical capital such as machinery, buildings, and tools.
Natural resources: Land, water, minerals, and other raw materials.
Entrepreneurial ability: The skill to combine other factors of production to create goods and services.
Factor market: Where firms buy factors of production from households. Product market: Where households buy goods and services from firms.
The Circular-Flow Diagram
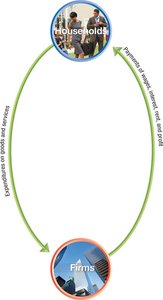
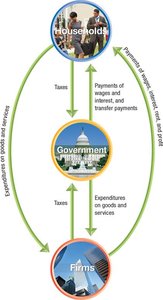
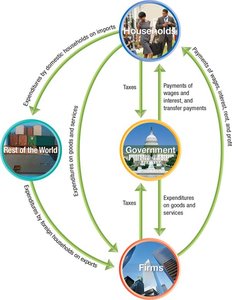
The circular-flow diagram illustrates the flow of resources, goods, services, and money in an economy. Households supply factors of production to firms and receive income in return. Firms supply goods and services to households, who pay for these products.
Money flows from firms to households as wages, rent, interest, and profit.
Money flows from households to firms as payment for goods and services.
Gross Domestic Product (GDP): Measuring Total Production
Definition and Components
Gross Domestic Product (GDP) is the market value of all final goods and services produced within a country during a specific period, typically one year. GDP is a key indicator of a nation's economic activity.
Market value: Goods and services are valued at their market prices.
Final goods and services: Only goods and services purchased by final users are counted to avoid double counting.
Produced within a country: Only production within a nation's borders is included, regardless of ownership.
During a period of time: Only new production within the measured period is counted; used goods are excluded.
Production and Income Approaches
GDP can be measured by either the total value of production (expenditure approach) or the total income generated (income approach). In theory, both methods yield the same result because total production equals total income.
Expenditure Approach to GDP
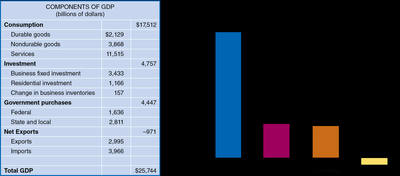
The Bureau of Economic Analysis (BEA) measures GDP using four major categories of expenditures:
Consumption (C): Household spending on goods and services, excluding new houses.
Investment (I): Spending on new factories, buildings, machinery, inventories, and new houses.
Government Purchases (G): Government spending on goods and services, excluding transfer payments.
Net Exports (NX): Exports minus imports.
The GDP formula is:
Value Added Approach
GDP can also be measured by summing the value added at each stage of production. Value added is the market value a firm adds to a product, calculated as the difference between the firm's sales and the cost of intermediate goods.
Example: For a shirt sold for $35, the value added at each stage (cotton farmer, textile mill, shirt company, retailer) sums to the final price.
Does GDP Measure What We Want It to Measure?
Shortcomings of GDP
GDP does not capture all economic activity or well-being. Important omissions include:
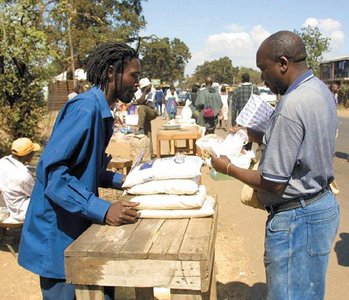
Household production: Non-market activities like childcare and cleaning are not counted.
Underground economy: Unreported or illegal transactions are excluded.
These omissions are more significant in developing countries, where the informal sector can be a large share of total output.
GDP and Well-Being
GDP per capita is often used to compare living standards, but it does not account for:
The value of leisure
Negative externalities like pollution
Crime and social problems
Income distribution
Real GDP versus Nominal GDP
Distinguishing Price and Quantity Changes
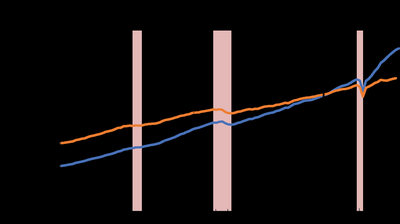
To distinguish between changes in output and changes in prices, economists use:
Nominal GDP: Value of final goods and services at current-year prices.
Real GDP: Value of final goods and services at base-year prices.
Real GDP provides a more accurate measure of economic growth by holding prices constant.
The GDP Deflator
The GDP deflator is a measure of the price level, calculated as:
The GDP deflator allows economists to calculate the inflation rate:
Other Measures of Total Production and Income
National Income and Product Accounts (NIPA)
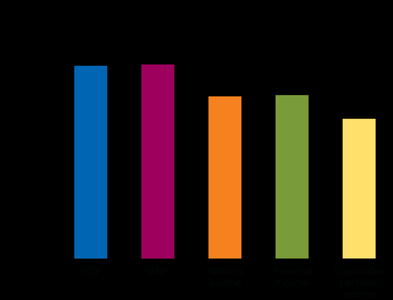
Besides GDP, the BEA publishes several related measures:
Gross National Product (GNP): Production by a nation's citizens, including overseas production.
National Income: GDP minus depreciation (consumption of fixed capital).
Personal Income: Income received by households, including transfer payments.
Disposable Personal Income: Personal income minus personal taxes; the amount households can spend or save.
The Division of Income
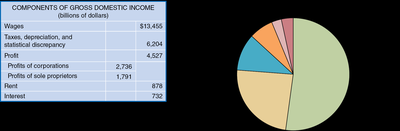
All production generates income, which is divided among wages, profits, rent, interest, and taxes. In practice, there may be a statistical discrepancy between GDP (production side) and GDI (income side).
Additional info: The notes above expand on the original content by providing definitions, formulas, and examples for each concept, ensuring the material is self-contained and suitable for exam preparation.
