 Indietro
Core Principles and Models in Macroeconomics: Foundations, Market Dynamics, and Government Intervention
Guida di studio - Note intelligenti
 Appunti personalizzati basati sui tuoi materiali, ampliati con definizioni chiave, esempi e contesto.
Economics: Foundations and Models
Defining Economics
Economics is the study of how individuals and societies allocate limited resources to satisfy unlimited wants. The discipline is divided into microeconomics (individual units and choices) and macroeconomics (overall economy and aggregate phenomena).
Scarcity: Limited resources necessitate choices and trade-offs.
Opportunity Cost: The value of the next-best alternative forgone when making a decision.
Trade-offs: Choosing more of one activity means less of another.
Economic Models and Assumptions
Economic models are simplified representations of reality used to analyze choices and predict outcomes. Models rely on assumptions to focus on key variables.
Ceteris Paribus: Holding all other factors constant to isolate the effect of one variable.
Testable Hypotheses: Good models allow for predictions that can be empirically tested.
Key Components of Microeconomic Models
Rationality: Decision makers use all available information and weigh costs and benefits.
Incentives: Changes in costs or benefits influence behavior.
Marginal Decision Making: Optimal decisions are made at the margin, considering incremental changes.
Example: Deciding how many Skittles to eat involves weighing the marginal benefit (MB) of each handful against the marginal cost (MC). The optimal decision occurs when MB = MC for the last unit consumed.

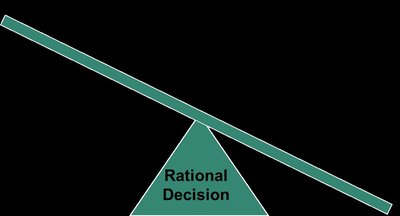
Additional info: Rational decision making is often illustrated using a balance or seesaw, representing the weighing of benefits and costs.
Trade-offs, Comparative Advantage, and the Market System
Production Possibilities Frontier (PPF)
The PPF is a model that illustrates scarcity, trade-offs, and opportunity costs. It shows the maximum combinations of two goods that can be produced with fixed resources and technology.
Efficient Points: On the PPF, resources are fully utilized.
Inefficient Points: Inside the PPF, resources are underutilized.
Unattainable Points: Outside the PPF, not possible with current resources.
Law of Increasing Opportunity Cost: As production of one good increases, the opportunity cost rises due to resource specialization.
Comparative and Absolute Advantage
Absolute Advantage: The ability to produce more of a good with the same resources. Comparative Advantage: The ability to produce a good at a lower opportunity cost.
Cloth (sheets) | Wine (kegs) | |
|---|---|---|
Portugal | 100 | 150 |
England | 90 | 60 |
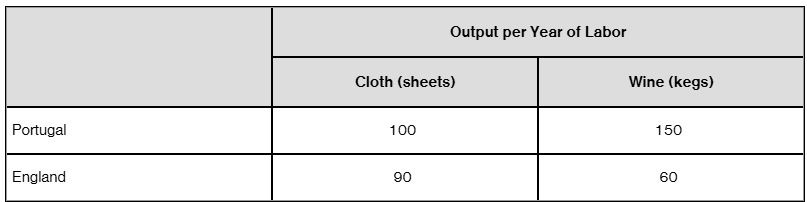
Example: Portugal has an absolute advantage in both goods, but a comparative advantage in wine, while England has a comparative advantage in cloth.
Gains from Trade
Specialization and trade allow countries to consume beyond their individual production possibilities, increasing total welfare.
Cloth (sheets) | Wine (kegs) | |
|---|---|---|
Portugal | 18,000 | 123,000 |
England | 63,000 | 18,000 |

Where Prices Come From: Demand and Supply
The Law of Demand
As the price of a product falls, the quantity demanded increases; as price rises, quantity demanded decreases. This is due to the substitution and income effects.
Substitution Effect: Consumers switch to relatively cheaper substitutes.
Income Effect: Lower prices increase purchasing power.
The Law of Supply
As the price of a product rises, the quantity supplied increases; as price falls, quantity supplied decreases.
Market Equilibrium
The equilibrium price is where quantity demanded equals quantity supplied. Market forces drive prices toward equilibrium.
Shifts in Demand and Supply
Changes in factors other than price (e.g., income, tastes, input costs) shift the demand or supply curves, leading to new equilibrium prices and quantities.
Increase in Demand: Shifts demand curve right, raising price and quantity.
Increase in Supply: Shifts supply curve right, lowering price and raising quantity.
Decrease in Demand: Shifts demand curve left, lowering price and quantity.
Decrease in Supply: Shifts supply curve left, raising price and lowering quantity.
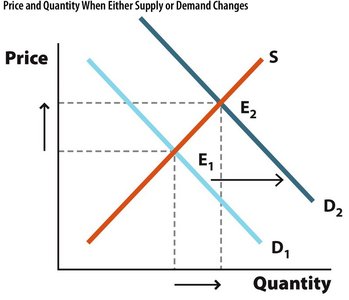
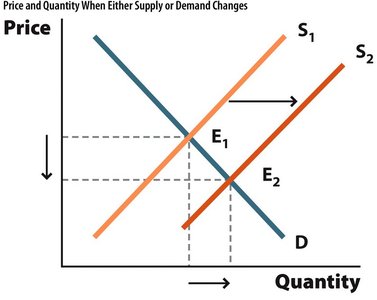
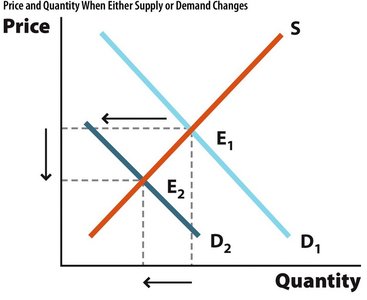
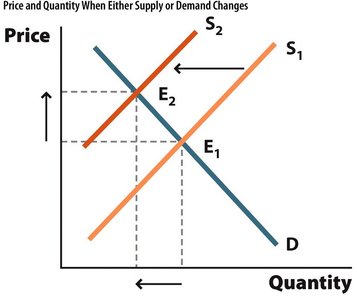
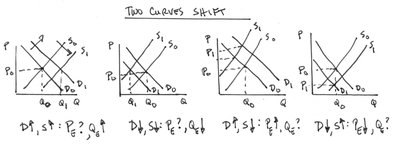
Additional info: When both curves shift, the impact on price or quantity may be indeterminate without further information.
Comparative Advantage and Gains from International Trade
Sources of Comparative Advantage
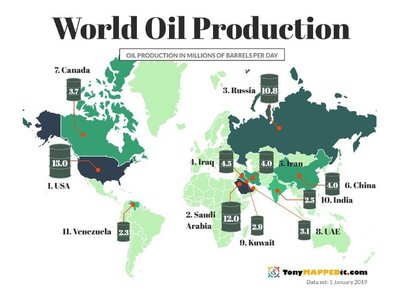
Comparative advantage arises from differences in climate, natural resources, labor and capital abundance, technology, and external economies.
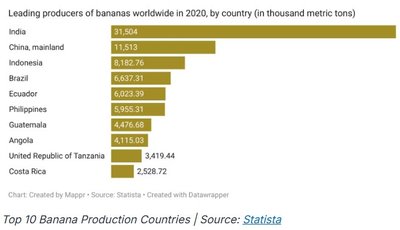
Climate and Natural Resources: Countries with favorable conditions specialize in certain goods (e.g., oil, bananas).
Relative Abundance of Labor and Capital: Developed countries may specialize in high-skill goods, developing countries in labor-intensive goods.
Technology: Access to advanced technology enhances productivity.
External Economies: Industry clusters reduce costs and foster innovation.



Globalization and Trade Growth
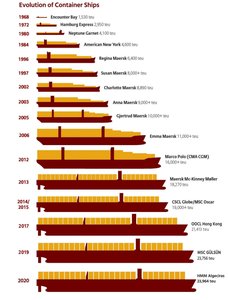
International trade has expanded due to lower shipping costs, improved communication, and reduced tariffs.
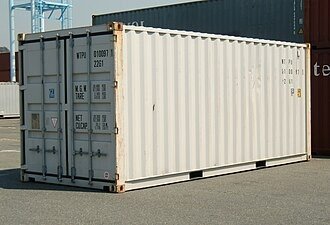
Containerization: Standardized containers have revolutionized shipping.
Air Travel: Real costs of international flights have decreased significantly.
Tariffs: Lower tariffs have facilitated greater imports and exports.



Economic Efficiency, Government Price Setting, and Taxes
Consumer and Producer Surplus
Consumer Surplus: The difference between what consumers are willing to pay and what they actually pay. Graphically, it is the area below the demand curve and above the price line. Producer Surplus: The difference between what producers receive and their costs. Graphically, it is the area above the supply curve and below the price line.
Total Economic Surplus and Market Efficiency
Total economic surplus (W) is the sum of consumer and producer surplus. The competitive equilibrium maximizes total welfare, as all units where MB ≥ MC are traded.
Government Intervention: Price Ceilings and Floors
Price Ceiling: Legally established maximum price. If set below equilibrium, leads to shortages, black markets, and reduced quality.
Price Floor: Legally established minimum price. If set above equilibrium, leads to surpluses and inefficiency.
Excise Taxes and Tax Incidence
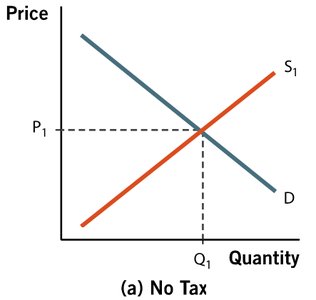
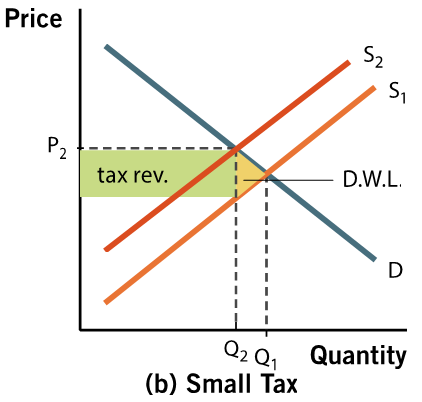
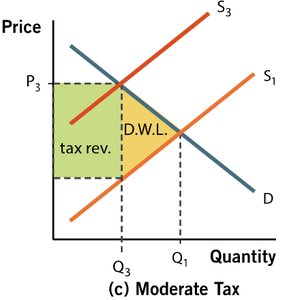
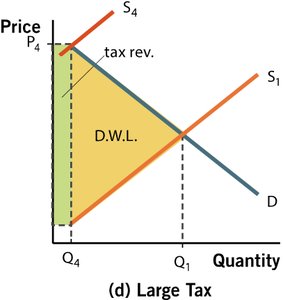
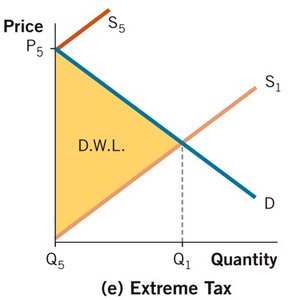
Excise taxes are per-unit taxes on goods. The burden of the tax (tax incidence) is shared between consumers and producers, depending on the relative elasticities of demand and supply.
Deadweight Loss (DWL): Taxes and price controls reduce total economic surplus, creating inefficiency.
Tax Revenue: Area representing government revenue from the tax.
Summary Table: Effects of Shifts in Demand and Supply
Change | Illustration | Impact on Price and Quantity |
|---|---|---|
Demand increases | Demand curve shifts right | Equilibrium price and quantity increase |
Supply increases | Supply curve shifts right | Equilibrium price decreases, quantity increases |
Demand decreases | Demand curve shifts left | Equilibrium price and quantity decrease |
Supply decreases | Supply curve shifts left | Equilibrium price increases, quantity decreases |
Key Formulas
Opportunity Cost:
Consumer Surplus: (area under demand curve above price)
Producer Surplus: (area above supply curve below price)
Total Economic Surplus:
Conclusion
Understanding the foundational models of economics, the mechanisms of market equilibrium, and the effects of government intervention is essential for analyzing macroeconomic phenomena. These principles provide the basis for further study in macroeconomics, including topics such as GDP, unemployment, inflation, and fiscal and monetary policy.
