 Indietro
Chapter 10 Study Guide
Guida di studio - Note intelligenti
 Appunti personalizzati basati sui tuoi materiali, ampliati con definizioni chiave, esempi e contesto.
Economic Growth
Measuring Economic Growth and Standard of Living
Economic growth refers to the sustained increase in a country's output of goods and services, typically measured by real GDP per capita. This metric is considered the best (though not perfect) indicator of the standard of living, as it reflects the average income and consumption possibilities for individuals in an economy.
Real GDP per capita: The value of all goods and services produced in a country, adjusted for inflation, divided by the population.
Standard of living: The level of material comfort, health, and wealth experienced by individuals in a society.
Example: The transition from outhouses to indoor flush toilets illustrates improvements in living standards due to economic growth.

Additional info: Real GDP per capita in the U.S. increased from $6,764 in 1900 to $65,415 in 2022, a more than 9-fold increase, reflecting substantial improvements in living conditions, such as widespread access to electricity, running water, and indoor plumbing.
The Rule of 70
The Rule of 70 is a simple formula used to estimate the number of years it takes for a variable, such as GDP or an investment, to double given a constant annual growth rate.
Formula:
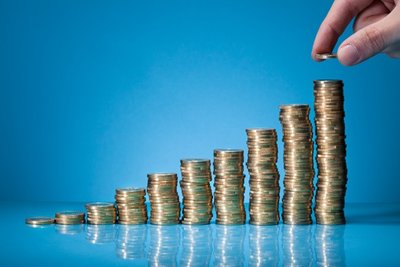
Application: If real GDP per capita grows at 2% per year, it will double in approximately 35 years.
Long-Run Economic Growth
Sources of Economic Growth
Long-run economic growth is driven by increases in labor productivity, which is the amount of goods and services produced by one worker or one hour of work. Productivity improvements depend on the quantity of capital per worker and the level of technology, with technological progress being the most significant factor.
Labor productivity: Output per worker or per hour.
Capital: Physical assets like machinery, equipment, and infrastructure.
Technology: Innovations and improvements in production processes.
Example: Modern farming equipment increases productivity compared to manual labor.


Additional info: Technological change is the most important driver of sustained increases in productivity and economic growth.
Potential GDP
Potential GDP is the level of real GDP achieved when all firms are operating at full capacity, using normal hours and a normal workforce. It is not the maximum possible output, but rather the sustainable output level under typical conditions.
Potential GDP increases as the labor force grows, new factories and office buildings are constructed, new machinery and equipment are installed, and technological change occurs.
The Financial System
Role and Structure of the Financial System
The financial system is essential for economic growth, as it provides funds for investment in capital equipment, worker training, new technologies, and research and development. It consists of financial markets and financial intermediaries, which channel funds from savers to borrowers and return profits to savers.
Financial markets: Platforms where securities are bought and sold (e.g., stock markets).
Financial intermediaries: Institutions like banks that facilitate the flow of funds.
Importance: Enables students to access loans, homeowners to obtain mortgages, and businesses to secure funding for expansion.
Additional info: The financial system is crucial for channeling savings into productive investments, which drive economic growth.
Business Cycles
Phases and Turning Points
The business cycle refers to the alternating periods of economic expansion and recession around the long-run growth trend. There are two main phases (expansion and recession) and two turning points (peak and trough).
Expansion: Period of increasing economic activity.
Peak: The highest point before a downturn.
Recession: Significant decline in economic activity lasting more than a few months.
Trough: The lowest point before recovery begins.
Sequence: Expansion → Peak → Recession → Trough
Inflation and Unemployment in the Business Cycle
Inflation typically rises during expansions and falls during recessions. Unemployment decreases during expansions and increases during recessions, except at the start of expansions when discouraged workers reenter the labor force and firms are slow to hire.
Inflation: General increase in prices; measured by the Consumer Price Index (CPI).
Unemployment: Percentage of the labor force without jobs but actively seeking work.
Example: After a recession, unemployment may temporarily rise as more people seek jobs.
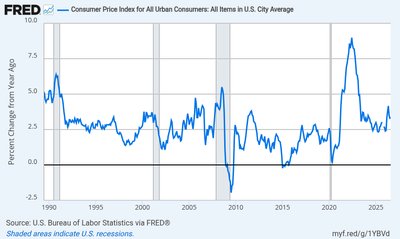
Additional info: Business cycles are visible in economic indicators such as industrial production, employment, real income, and wholesale-retail trade.
Practice Question Example
Question: An expansion comes to an end with a business cycle trough. Answer: D) expansion; trough
Summary Table: Business Cycle Phases and Effects
Phase | Economic Activity | Inflation | Unemployment |
|---|---|---|---|
Expansion | Increasing | Rises | Falls (except at start) |
Peak | Highest | Highest | Lowest |
Recession | Decreasing | Falls | Rises |
Trough | Lowest | Lowest | Highest |
