 Indietro
Foundations and Models in Macroeconomics: Chapter 1 Study Guide
Guida di studio - Note intelligenti
 Appunti personalizzati basati sui tuoi materiali, ampliati con definizioni chiave, esempi e contesto.
Economics: Foundations and Models
Three Key Economic Ideas
This section introduces the fundamental assumptions that underpin economic analysis. Economists believe that individuals and firms act rationally, respond to incentives, and make decisions at the margin.
People Are Rational: Economic agents use available information to achieve their goals, weighing costs and benefits before making decisions. Example: Firms like Apple set prices to maximize profit, not randomly.
People Respond to Economic Incentives: Changes in incentives alter behavior. Example: DNA collection for felons reduces repeat offenses, showing even criminals respond to incentives.
Optimal Decisions Are Made at the Margin: Most choices involve incremental changes. Marginal analysis compares the additional benefit (marginal benefit) and additional cost (marginal cost) of an action. Formula:
The Economic Problem That Every Society Must Solve
Scarcity forces societies to make choices about resource allocation. Every economy must answer three basic questions: what to produce, how to produce, and who receives the output.
Trade-off: Producing more of one good means producing less of another due to limited resources.
Opportunity Cost: The value of the next best alternative forgone. Example: Funding space exploration may mean less funding for cancer research.
Production Methods: Firms choose between different techniques based on costs and available resources.
Distribution: Income determines who receives goods and services; government policies can alter this distribution.
Centrally Planned, Market, and Mixed Economies
Economies differ in how they allocate resources. The U.S. is best described as a mixed economy, combining market mechanisms with government intervention.
Centrally Planned Economy: Government decides resource allocation.
Market Economy: Households and firms interact in markets to allocate resources.
Mixed Economy: Most decisions are made in markets, but government plays a significant role.
Efficiency and Equity in Market Economies
Market economies are generally more efficient, but not always equitable. Efficiency is achieved through competition and voluntary exchange, while equity concerns the fair distribution of benefits.
Productive Efficiency: Goods produced at lowest cost.
Allocative Efficiency: Production matches consumer preferences; last unit's marginal benefit equals marginal cost.
Voluntary Exchange: Both buyer and seller benefit from transactions.
Equity: Fairness in distribution may require trade-offs with efficiency.
Economic Models
Economists use models—simplified representations of reality—to analyze and predict economic outcomes. Models rely on assumptions and are tested using data.
Steps in Model Building:
Decide on assumptions
Formulate a testable hypothesis
Use data to test hypothesis
Revise model if necessary
Retain revised model for future analysis
Assumptions: Models often assume consumers maximize well-being and firms maximize profit.
Hypothesis Testing: Statistical methods are used to evaluate hypotheses about economic variables.
Positive vs. Normative Analysis
Economics distinguishes between positive analysis (what is) and normative analysis (what ought to be). Most economic research is positive, but policy decisions often require normative judgments.
Positive Analysis: Objective, fact-based.
Normative Analysis: Subjective, value-based.
Microeconomics vs. Macroeconomics
Economics is divided into microeconomics and macroeconomics. Microeconomics studies individual agents and markets, while macroeconomics examines the economy as a whole.
Microeconomics: Choices of households and firms, market interactions, government influence.
Macroeconomics: Aggregate phenomena such as inflation, unemployment, and economic growth.
Economic Skills and Careers
Studying economics develops analytical skills valuable in many careers. Economists help businesses and governments make better decisions.
Skills: Problem-solving, data analysis, critical thinking.
Career Outcomes: Economics majors often earn higher salaries; causation vs. correlation is debated.
Important Economic Terms
Economics uses precise terminology. Key terms include:
Technology: Processes used to produce goods and services.
Capital: Manufactured goods used in production.
Using Graphs and Formulas
Graphs and formulas are essential tools for economic analysis. They help visualize relationships and perform calculations.
Basic Operations: Addition, subtraction, multiplication, division, fractions, decimals, percentages, simple algebra.
Percentage Change Formula:

Types of Graphs
Different graphs are used to represent economic data:
Bar Graphs and Pie Charts: Show market shares or proportions.

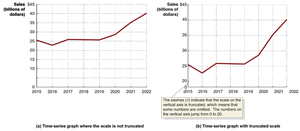
Time-Series Graphs: Show changes over time.
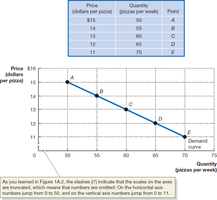
Plotting Price and Quantity: Used to illustrate demand curves.
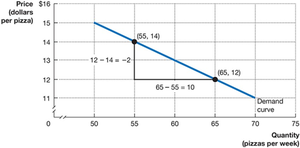
Calculating Slope
The slope of a line measures the rate of change between two variables. For a straight line, slope is constant and calculated as:
Formula:
Example: If price decreases from \frac{12-14}{65-55} = \frac{-2}{10} = -0.2$
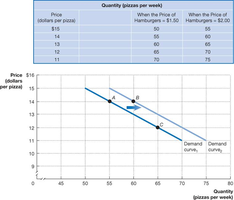
Showing Three Variables on a Graph
Graphs can illustrate how a third variable affects the relationship between two others, such as how the price of hamburgers affects pizza demand.
Example: Changes in hamburger prices shift the demand curve for pizza.
Positive and Negative Relationships
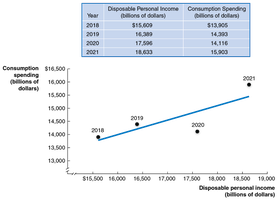
Economic variables can be positively or negatively related. A positive relationship means both variables increase together; a negative relationship means one increases as the other decreases.
Example: Disposable income and consumption spending are positively related.
Cause and Effect in Graphs
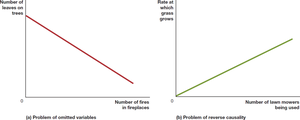
Graphs can suggest relationships but do not always prove causality. Problems such as omitted variables and reverse causality can mislead conclusions.
Example: More fires in fireplaces do not cause leaves to fall; more lawn mowers do not cause grass to grow faster.
Linear and Nonlinear Relationships
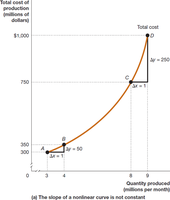
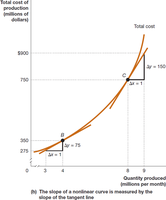
Most economic relationships are not perfectly linear. Nonlinear curves have varying slopes, which can be approximated or measured using tangent lines.
Example: Total cost curves for production are often nonlinear.
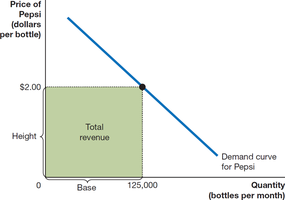
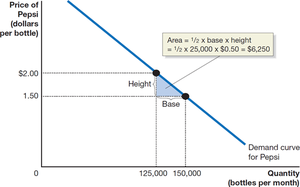
Areas Under Curves: Revenue and Surplus
Areas of rectangles and triangles on graphs represent important economic quantities, such as total revenue and consumer/producer surplus.
Total Revenue:
Area of a Triangle:
Summary of Using Formulas
When using formulas, ensure you understand the concept, use the correct formula, and check that your answer is economically reasonable.
Example: Calculating firm revenue should not yield a negative number.
Additional info: These notes provide a comprehensive overview of Chapter 1, suitable for exam preparation in a college-level macroeconomics course. All images included directly reinforce the concepts explained in the adjacent paragraphs.
