 Indietro
Functions of One Variable: Mathematical Foundations for Economic Analysis
Guida di studio - Note intelligenti
 Appunti personalizzati basati sui tuoi materiali, ampliati con definizioni chiave, esempi e contesto.
Functions of One Variable
Introduction
Functions are fundamental tools in both pure and applied mathematics, and they are especially important in economics. Economic concepts such as demand, supply, cost, production, and consumption are often described using functions. Understanding functions of one variable is essential for modeling and analyzing economic relationships.
Function: A rule that assigns each value of one variable (independent) to a unique value of another variable (dependent).
Economic Examples: Demand and supply functions, cost functions, production functions.
Graphical Representation: Functions can be visualized as curves or lines on a graph, which helps in understanding their behavior.
Tabular Representation: Functions can also be represented in tables, showing the relationship between variables.
Verbal Representation: Economic statements such as "national product is a function of investment" express functional relationships.
Definitions and General Properties
Definition of a Function
A function of one variable is a mathematical relationship where each input (independent variable) corresponds to exactly one output (dependent variable). In economics, this is used to model how one economic variable responds to changes in another.
Notation: If y depends on x, we write y = f(x).
Rule of Assignment: The function specifies a definite rule for relating x to y.
Domain and Range: The domain is the set of possible values for x; the range is the set of possible values for y.
Graphs of Functions
Graphical Representation
Graphs are a powerful way to visualize the relationship between variables in a function. In economics, graphs are used to illustrate demand and supply curves, cost functions, and more.
Axes: The horizontal axis (x) represents the independent variable; the vertical axis (y) represents the dependent variable.
Shape: The shape of the graph depends on the functional form (linear, quadratic, etc.).
Linear Functions
Common Functional Forms in Economics
Linear functions are widely used in economics to model relationships where changes in one variable lead to proportional changes in another. The general form is y = ax + b.
Dependent and Independent Variables: y is the dependent variable; x is the independent variable.
Implicit Function: Sometimes written as f(x, y) = 0.
Economic Application: Linear demand and supply functions, cost functions.
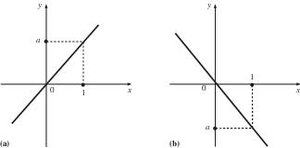
Example: A demand function y = 2x + 3 shows how quantity demanded changes with price.
Linear Function with Intercept
Linear functions may include an intercept, representing the value of the dependent variable when the independent variable is zero.
Equation: y = ax + b
Intercept: The value of y when x = 0 is b.
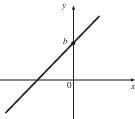
Example: In a supply function, the intercept may represent fixed costs.
Quadratic Functions and Polynomials
Quadratic Functions
Quadratic functions are used in economics to model relationships with increasing or decreasing returns, such as cost functions or utility functions. The general form is y = ax^2 + bx + c.
Convex Form: If a > 0, the graph opens upward (U-shaped).
Concave Form: If a < 0, the graph opens downward (inverted U-shaped).
Vertex: The maximum or minimum point is at x = -b/(2a).
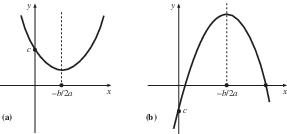
Example: A cost function y = 2x^2 - 4x + 1 may represent increasing marginal costs.
General Polynomials
Polynomials of higher degree (cubic, quartic, etc.) can model more complex economic relationships, such as production functions with multiple inflection points.
Cubic Function: y = ax^3 + bx^2 + cx + d
Application: Used in modeling non-linear cost or revenue functions.
Power, Exponential, and Logarithmic Functions
Power Functions
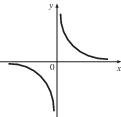
Power functions have the form y = x^a and are used in economics to model production functions and utility functions.
Positive and Negative Powers: The graph changes shape depending on the exponent.
Exponential Functions
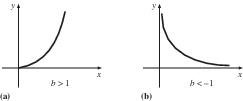
Exponential functions, y = b^x, are used to model growth processes, such as population growth or compound interest.
Growth: If b > 1, the function increases rapidly.
Decay: If 0 < b < 1, the function decreases rapidly.
Logarithmic Functions
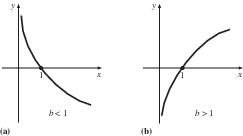
Logarithmic functions, y = log_b(x), are used in economics to model diminishing returns and utility functions.
Shape: The graph increases slowly for large values of x.
Application: Used in modeling utility and information functions.
Summary Table: Common Functional Forms in Economics
Function Type | General Form | Economic Application |
|---|---|---|
Linear | Demand, supply, cost functions | |
Quadratic | Cost, utility functions | |
Cubic | Complex production/cost functions | |
Power | Production, utility functions | |
Exponential | Growth, compound interest | |
Logarithmic | Utility, information functions |
Additional info: These mathematical forms are foundational for modeling economic relationships and are frequently used in macroeconomic analysis, such as in aggregate demand and supply, national income determination, and growth models.
