 Indietro
Lesson 1: The Policy and Practice of Macroeconomics – Study Notes
Guida di studio - Note intelligenti
 Appunti personalizzati basati sui tuoi materiali, ampliati con definizioni chiave, esempi e contesto.
Introduction to Macroeconomics
Definition and Scope
Macroeconomics is the study of economic activity and prices in the overall national or regional economy. It focuses on aggregate phenomena such as GDP, unemployment, inflation, and policy impacts, drawing heavily on microeconomic foundations.
Macroeconomics: Examines the behavior of the economy as a whole.
Microeconomics: Studies choices by individuals, households, and firms.
Key macroeconomic variables: GDP, unemployment rate, inflation rate, interest rates.
Introductory Economic Models
Modeling Aggregate Trends
Macroeconomists use economic theory to build models that simplify real-world phenomena. These models help explain relationships between variables and guide policy decisions.
Economic model: A simplification of reality to analyze economic phenomena.
Endogenous variables: Explained within the model (e.g., unemployment rate).
Exogenous variables: Taken as given (e.g., government spending, Federal Funds rate).
Models use equations and graphs informed by theory to explain how exogenous variables affect endogenous variables.
Findings are compared to real-world data for validation.
Role of Equations and Graphs
Algebraic equations ensure logical consistency in models, while graphs make models intuitive and accessible. Economists communicate key insights in words, supported by mathematical and graphical analysis.
Equations: Provide precise relationships between variables.
Graphs: Visualize trends and relationships for easier understanding.
Macroeconomic Policy
Policy Goals
Macroeconomic models inform policy decisions aimed at improving economic outcomes. Ideal policies seek to:
Increase economic growth
Reduce unemployment
Stabilize prices (control inflation)
Current Issues in Macroeconomics
The Covid Crisis, Inflation, and Interest Rates
The Covid-19 pandemic led to government lockdowns, reduced economic activity, and increased unemployment. Massive fiscal stimulus increased government spending, contributing to inflation.
U.S. government enacted $4.6 trillion in Covid relief.
Inflation peaked at 9% in mid-2022.
The Federal Reserve reduced policy interest rates to 0% in 2020, then raised them to 3.5%-3.75% in 2022.
Increase in Public Debt
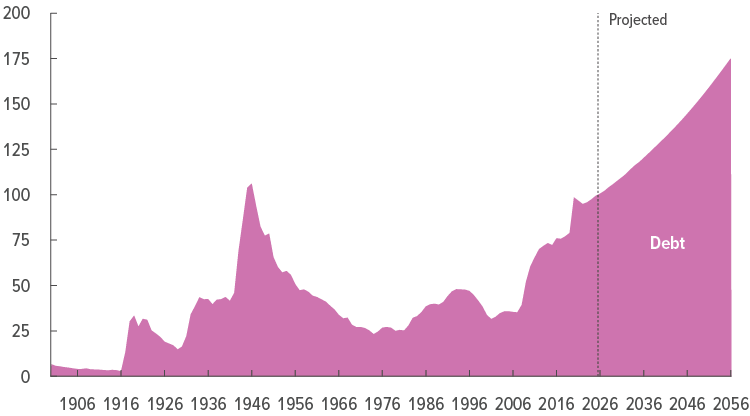
Governments borrow when expenditures exceed revenues, resulting in budget deficits. Public debt is measured as a percentage of GDP, indicating the debt burden relative to the economy's size.
Persistent budget deficits have increased debt-to-GDP ratios in advanced economies.
Debt-to-GDP ratio is a key indicator of fiscal sustainability.
Budget Outlook and Projections
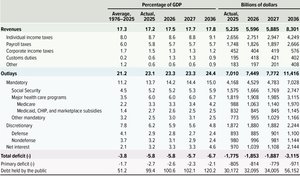
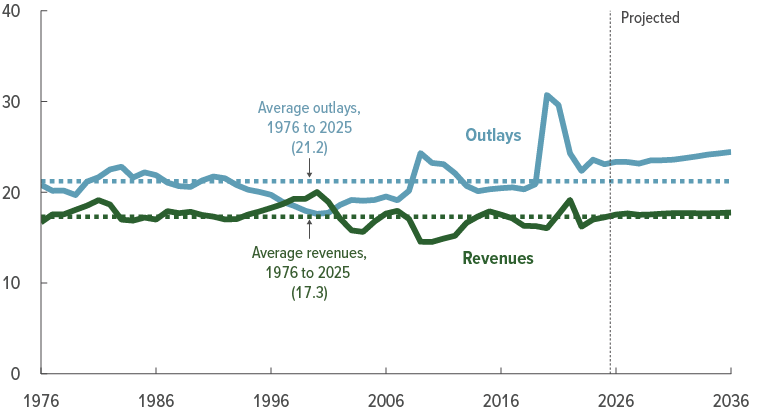
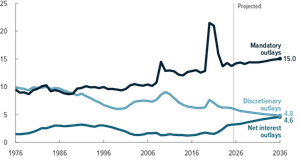
The Congressional Budget Office (CBO) projects continued high deficits and rising debt levels. Key figures for 2026 include:
Budget deficit: $1.9 trillion
Debt held by the public: 101% of GDP
Outlays: $7.4 trillion
Revenues: $5.6 trillion
Policy Questions
Is a higher debt-to-GDP ratio a cause for concern?
Should governments reduce budget deficits and lower debt-to-GDP ratios?
What policy measures can achieve this? (Reduce spending, increase taxes, or both?)
Productivity and Economic Growth
The Growth of China
China's economy grew rapidly in the early 2000s, averaging 9% annual growth compared to 2.6% in the U.S. This allowed China to catch up with the U.S. in terms of total GDP, though not in GDP per capita.
Shift from centrally controlled to free market economy
Heavy investment in infrastructure
Low-cost labor and manufacturing hub
Increase in education and human capital
Lessons for developing regions: Some aspects of China's experience can be replicated, but historical and cultural differences limit full replication.
Income and Consumption
Growth and Income Inequality
Income inequality has increased in most developed countries over the past 40 years, especially in the U.S. Measures include the share of income received by the top 1%, 10%, and the Gini coefficient.
Rising inequality can cause political instability, reduce social mobility, and weaken consumer spending.
Gini Coefficient: Measures income distribution (0 = perfect equality, 1 = perfect inequality).
Policy Responses to Inequality
Progressive taxation
More public education spending
Higher minimum wage
Income transfer programs (social welfare)
Externalities and Sustainable Growth
Global Warming and Its Implications
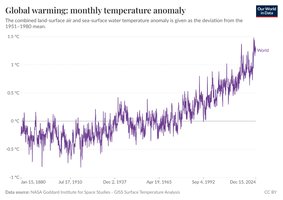
Global warming is a major challenge for sustainable growth. Since the 1960s, global temperatures have steadily risen, with 2024 being the hottest year on record. Greenhouse gases are the primary cause.
Projected temperature increase: 2.6°C – 3.1°C above pre-industrial levels if no action is taken.
Potential consequences: More extreme weather, uninhabitable regions, sea level rise, damage to marine ecosystems.
Policy Measures for Climate Change
Generation and use of green energy (solar, wind, etc.)
Multilateral treaties (e.g., Paris Agreement to limit global temperature rise to 1.5°C)
Challenges: Public willingness to bear costs, developed countries subsidizing developing countries
Summary Table: Budget Components and Projections
The following table summarizes key budget components and projections for revenues, outlays, deficit, and debt:
Category | 2026 (% of GDP) | 2026 (Billions $) |
|---|---|---|
Revenues | 17.7 | 5,606 |
Outlays | 21.4 | 7,409 |
Deficit | -3.7 | -1,803 |
Debt held by the public | 101.2 | 14,095 |
Additional info: Table entries inferred from CBO projections and image_1.
