 Indietro
Supply and Demand: Foundations of Market Equilibrium
Guida di studio - Note intelligenti
 Appunti personalizzati basati sui tuoi materiali, ampliati con definizioni chiave, esempi e contesto.
Supply and Demand
Markets and Competition
Markets are fundamental to the study of economics, serving as the arena where buyers and sellers interact to exchange goods and services. In a competitive market, there are many buyers and sellers, each with a negligible effect on the market price. A perfectly competitive market is characterized by:
All goods being exactly the same
Numerous buyers and sellers, so no individual can influence the price ("price takers")
For analytical simplicity, we often assume markets are perfectly competitive.
Demand
Quantity Demanded and the Law of Demand
The quantity demanded of a good is the amount that buyers are willing and able to purchase at a given price. The law of demand states that, other things equal, the quantity demanded of a good falls when the price of the good rises.
Demand Curve: A graphical representation showing the relationship between the price of a good and the quantity demanded.
For example, the demand curve for oil shows how much oil is demanded at various prices.
Why Do Demand Curves Slope Down?
At higher prices, only high-value uses are satisfied.
As price falls, the good is used for lower-value purposes as well.
Demand Curve Shifters
The demand curve shifts when non-price determinants of demand change. These include:
Number of Buyers: More buyers increase demand at each price.
Income: Demand for a normal good rises with income; demand for an inferior good falls with income.
Prices of Related Goods: Substitutes (increase in price of one increases demand for the other); Complements (increase in price of one decreases demand for the other).
Tastes
Expectations
Example: Demand Curve for Music Downloads
If the price of AirPods falls (a complement to music downloads), the demand curve for music downloads shifts to the right.
If the price of music downloads falls, there is a movement along the demand curve, not a shift.

Supply
Quantity Supplied and the Law of Supply
The quantity supplied of a good is the amount that sellers are willing and able to sell at a given price. The law of supply states that, other things equal, the quantity supplied of a good rises when the price of the good rises.
Supply Curve: A graphical representation showing the relationship between the price of a good and the quantity supplied.
For example, the supply curve for oil shows how much oil is supplied at various prices.
Why Do Supply Curves Slope Up?
At low prices, only low-cost suppliers can profitably produce the good.
As price rises, higher-cost suppliers enter the market.
Supply Curve Shifters
The supply curve shifts when non-price determinants of supply change. These include:
Input Prices: Lower input costs increase supply.
Technology: Technological advances increase supply.
Number of Sellers: More sellers increase supply.
Expectations
Example: Supply Curve for Tax Return Preparation Software
If a technological advance lowers production costs, the supply curve shifts to the right.
If professional tax preparers raise their prices, demand for software may increase, but this does not shift the supply curve.

Market Equilibrium
Equilibrium Price and Quantity
Equilibrium occurs where quantity supplied equals quantity demanded. The equilibrium price is the price that balances supply and demand, and the equilibrium quantity is the quantity bought and sold at that price.
Surplus and Shortage
Surplus (Excess Supply): When quantity supplied exceeds quantity demanded. Sellers cut prices to eliminate the surplus, moving the market toward equilibrium.
Shortage (Excess Demand): When quantity demanded exceeds quantity supplied. Sellers raise prices to eliminate the shortage, moving the market toward equilibrium.
Shifts in Supply and Demand: Comparative Statics
Three Steps to Analyzing Changes in Equilibrium
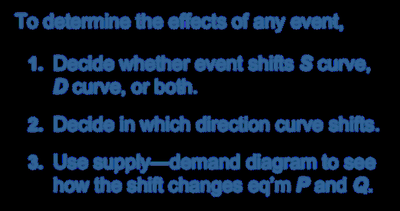
To determine the effects of any event on equilibrium price and quantity:
Decide whether the event shifts the supply curve, demand curve, or both.
Determine the direction of the shift.
Use a supply-demand diagram to see how the shift affects equilibrium price and quantity.
Examples
Increase in Price of Gasoline: Shifts demand for electric cars to the right, increasing both equilibrium price and quantity.
Technological Improvement in Electric Car Production: Shifts supply to the right, lowering equilibrium price and increasing quantity.
Both Demand and Supply Shift Right: Quantity increases, but the effect on price depends on the relative magnitude of the shifts.
Summary Table: Demand and Supply Shifters
Determinant | Effect on Demand | Effect on Supply |
|---|---|---|
Price of the Good | Movement along curve | Movement along curve |
Income | Shifts (normal/inferior goods) | No effect |
Prices of Related Goods | Shifts (substitutes/complements) | No effect |
Tastes/Expectations | Shifts | Shifts (expectations) |
Number of Buyers/Sellers | Shifts (buyers) | Shifts (sellers) |
Input Prices/Technology | No effect | Shifts |
Key Equations
Equilibrium Condition:
Surplus:
Shortage:
