 Indietro
The Economic Problem: Production Possibilities, Opportunity Cost, and Gains from Trade
Guida di studio - Note intelligenti
 Appunti personalizzati basati sui tuoi materiali, ampliati con definizioni chiave, esempi e contesto.
The Production Possibilities Frontier (PPF)
Definition and Basic Concepts
The Production Possibilities Frontier (PPF) is a fundamental model in macroeconomics that illustrates the maximum combinations of two goods or services that an economy can produce, given its resources and technology. The PPF represents the boundary between attainable and unattainable production levels, assuming ceteris paribus (all other factors held constant).
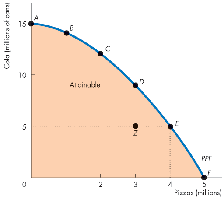
Efficient Production: Points on the PPF are efficient; resources are fully utilized.
Inefficient Production: Points inside the PPF indicate underutilization of resources.
Unattainable Production: Points outside the PPF are not possible with current resources.
Key Principle: The optimal production point occurs where Marginal Benefit = Marginal Cost.
PPF Example: Pizza and Cola
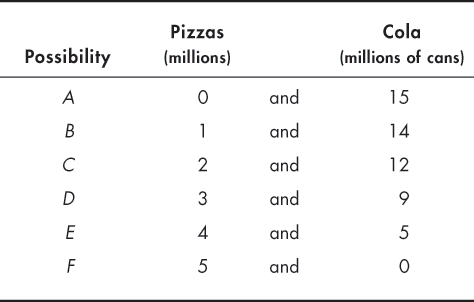
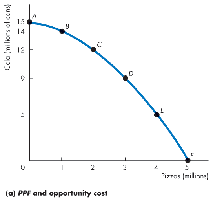
Consider an economy producing pizzas and cola. The PPF shows the trade-off between these two goods. Each point (A-F) on the frontier represents a different allocation of resources between pizzas and cola.
Table: The table above shows possible combinations of pizzas and cola that can be produced efficiently.
Graph: The PPF curve visually demonstrates the attainable region and the trade-off between the two goods.
Opportunity Cost
Concept and Calculation
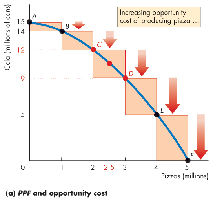
Opportunity cost is the value of the next best alternative forgone when making a choice. On the PPF, moving from one point to another involves sacrificing some amount of one good to produce more of the other.
Marginal Cost: The opportunity cost of producing one more unit of a good is also its marginal cost.
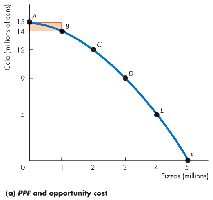
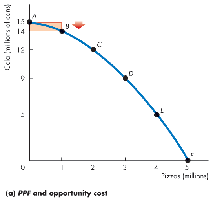
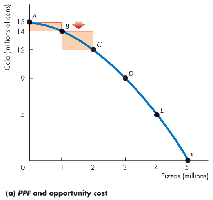
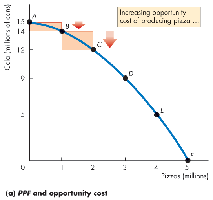
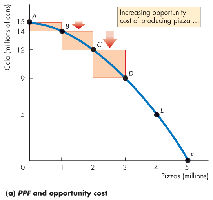
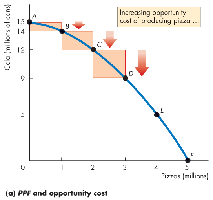
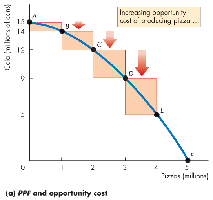
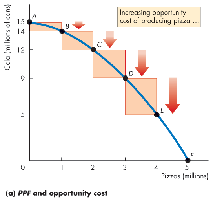
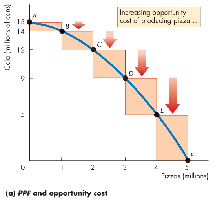
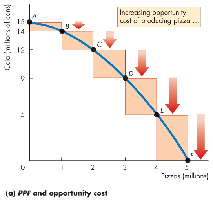
Increasing Marginal Cost: As production of one good increases, the opportunity cost (in terms of the other good) typically rises, reflected by the PPF's increasing slope.
Marginal Cost Visualization
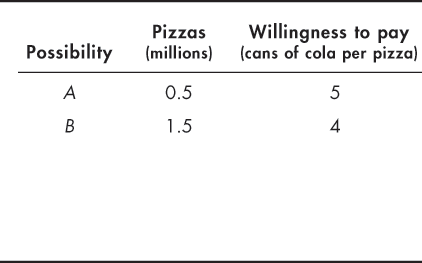
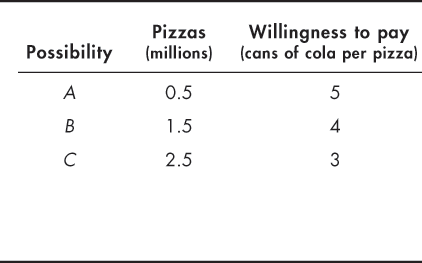
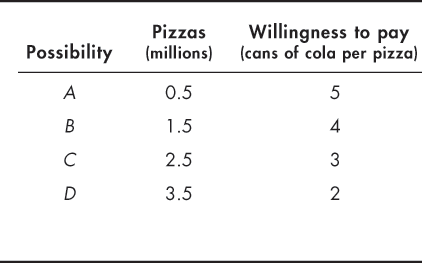
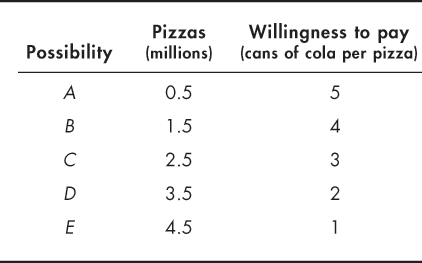
The marginal cost of producing pizzas, measured in cans of cola forgone per pizza, increases as more pizzas are produced. This is shown in the stepwise graph below.
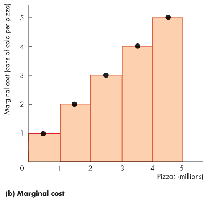
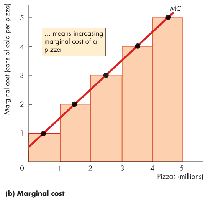
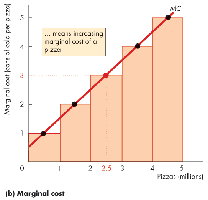
Formula: Opportunity cost of producing one more pizza = Change in cola / Change in pizza
Marginal Benefit and Preferences
Marginal Benefit
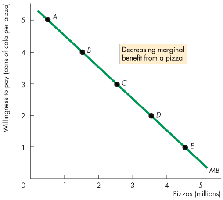
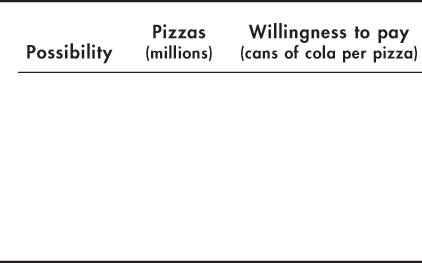
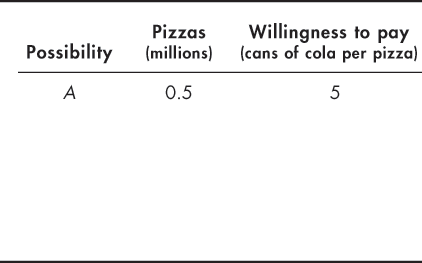
Marginal benefit is the additional satisfaction or utility gained from consuming one more unit of a good. According to the principle of decreasing marginal utility, the marginal benefit of an extra pizza decreases as the quantity consumed increases.
Efficient Resource Allocation
Resources are allocated efficiently when production occurs at a point on the PPF where marginal benefit equals marginal cost. This ensures that the mix of goods produced maximizes total welfare.
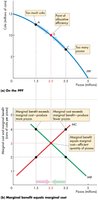
Key Point: Efficient allocation is not just on the PPF, but at the point where MB = MC.
Comparative Advantage and Gains from Trade
Comparative Advantage
Comparative advantage exists when a producer can produce a good at a lower opportunity cost than another. This principle underlies the gains from trade between individuals or countries.
Absolute Advantage: Having lower unit costs in producing a good.
Comparative Advantage: Having lower opportunity cost in producing a good.
Trade allows both parties to specialize in the goods for which they have comparative advantage, resulting in Pareto improvements (both are better off).
Gains from Trade Example
Suppose Joe and Liz face different opportunity costs for making salads and smoothies. Liz has an absolute advantage in smoothies, but Joe has a comparative advantage in salads. By specializing and trading, both can consume beyond their individual PPFs.
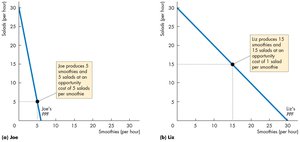
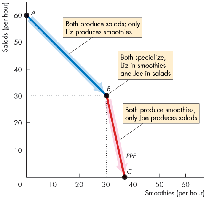
Key Point: Specialization and trade allow both parties to reach points beyond their individual production frontiers.
Discussion: Is Free Trade Always Good?
Limitations of the Ricardian Model
The Ricardian model demonstrates that specialization and trade based on comparative advantage can increase efficiency and output. However, real-world trade may involve issues such as unemployment, environmental concerns, and geopolitical competition. The model assumes balanced trade and no externalities, so its pro-trade message should be considered alongside other factors when evaluating trade policies.
Model Assumptions: No unemployment, balanced trade, no strategic rivalry.
Real-World Considerations: Trade can have negative side effects not captured by the model.
Conclusion: Comparative advantage is a powerful concept, but not the only factor in trade policy decisions.
