 Indietro
Microbial Metabolism: Pathways, Energy, and Regulation
Guida di studio - Note intelligenti
 Appunti personalizzati basati sui tuoi materiali, ampliati con definizioni chiave, esempi e contesto.
Microbial Metabolism
Overview of Metabolism
Microbial metabolism encompasses all chemical reactions that occur within a microorganism, enabling growth, reproduction, and maintenance. These reactions require energy and raw materials, and their byproducts are often used for classification purposes.
Metabolism: The sum of all chemical reactions in a cell.
Growth Requirements: Energy source, carbon, nitrogen, water, and ions (especially iron).
Energy and Raw Materials: Human bodies provide these for many microbes.
Classification: Growth requirements and metabolic byproducts help classify microbes.
Energy Storage and ATP
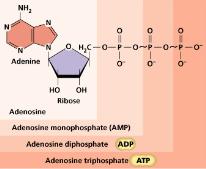
Microbes harvest energy from the breakdown of organic substrates such as lipids, carbohydrates, and proteins. Energy is stored in the high-energy phosphate bonds of adenosine triphosphate (ATP), which acts as the cell's energy currency.
ATP: Adenosine triphosphate, the primary energy carrier in cells.
Phosphorylation: Addition of inorganic phosphate to ADP to form ATP. Types include substrate-level, oxidative, and photophosphorylation.
Long-term Storage: Polysaccharides and fats serve as long-term energy reserves.
Energy Generation and Use
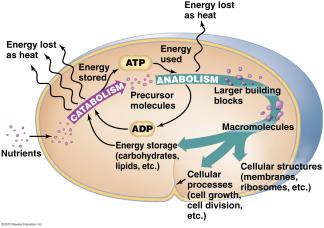
Energy generation and use are tightly coupled in cells. Catabolic reactions break down molecules to release energy, while anabolic reactions use energy to build complex molecules.
Catabolism: Breakdown of large molecules into smaller ones; exergonic (releases energy).
Anabolism: Synthesis of large molecules from smaller ones; endergonic (requires energy).
ATP Cycle: ATP is produced during catabolism and consumed during anabolism.
Reduction & Oxidation Reactions (REDOX)
Redox Reactions in Metabolism
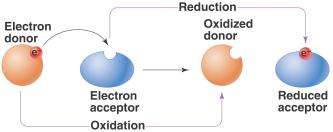
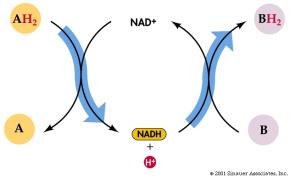
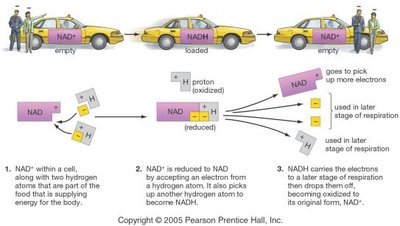
Cells make ATP by releasing energy in the form of electrons from organic and inorganic compounds. Redox reactions are always coupled, involving electron donors and acceptors.
Oxidation: Loss of electrons.
Reduction: Gain of electrons.
Electron Carriers: Molecules such as NAD+, NADP+, and FAD temporarily store energy from redox reactions.
Electron Carrier Molecules
Electron carriers are essential for transferring electrons during metabolic reactions. They are derived from B vitamins and play a central role in energy metabolism.
NAD+: Nicotinamide adenine dinucleotide.
NADP+: Nicotinamide adenine dinucleotide phosphate.
FAD: Flavin adenine dinucleotide.
Proteins and Enzymes in Metabolism
Protein Structure and Function
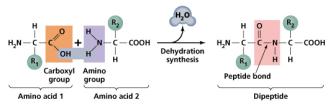
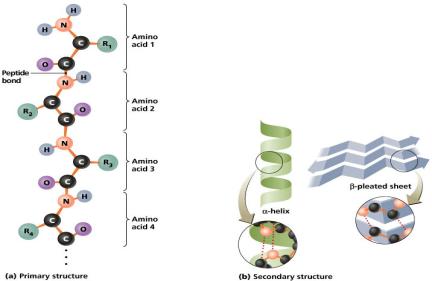
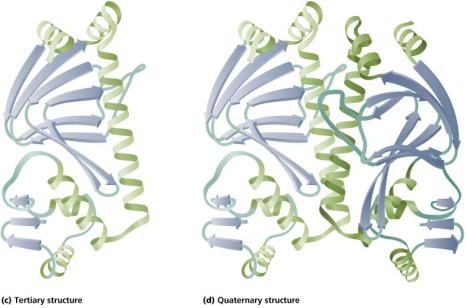
Proteins are cellular workhorses, performing essential functions such as catalysis, regulation, transport, and defense. They are composed of amino acids linked by peptide bonds.
Peptide Bond: Covalent bond formed between amino acids.
Protein Functions: Structural maintenance, enzymatic catalysis, regulation, transport, and defense.
Enzymes in Metabolism
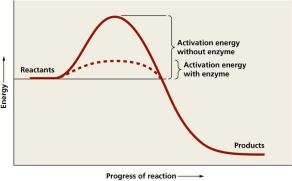
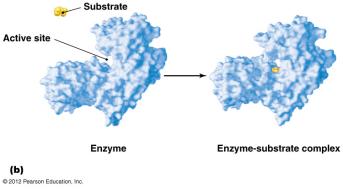
Enzymes are proteins that act as catalysts, lowering the activation energy of chemical reactions. They exhibit substrate specificity and may require cofactors or coenzymes.
Catalysts: Speed up reactions without being consumed.
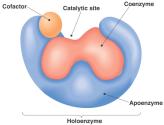
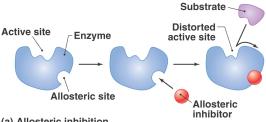
Active Site: Region of the enzyme where substrate binds.
Cofactors and Coenzymes: Non-protein helpers required by some enzymes.
Factors Influencing Enzyme Activity
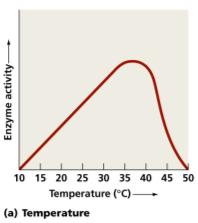
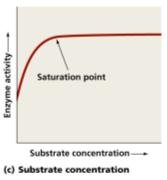
Several factors affect the rate of enzymatic reactions, including temperature, pH, substrate concentration, and inhibitors.
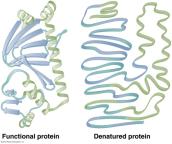
Temperature: Enzyme activity increases with temperature up to an optimum, then decreases due to denaturation.
pH: Each enzyme has an optimal pH range.
Substrate Concentration: Activity increases with substrate concentration until saturation is reached.
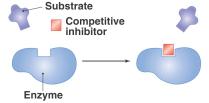
Inhibitors: Substances that block or alter enzyme activity.
Carbohydrate Catabolism
Overview of Carbohydrate Catabolism
Carbohydrate catabolism is a primary energy source for many organisms. Glucose is the most common carbohydrate used, and it can be catabolized via cellular respiration or fermentation.
Cellular Respiration: Complete breakdown of glucose to CO2 and water.
Fermentation: Partial oxidation of glucose, yielding less ATP.
Glycolysis (EMP Pathway)
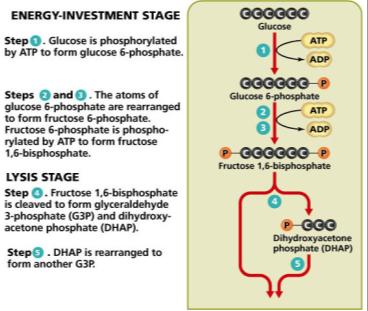
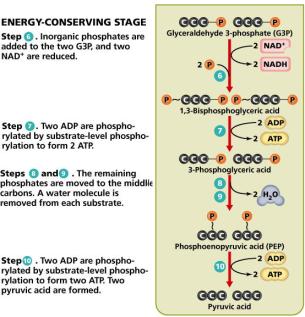
Glycolysis is the first step in glucose catabolism, splitting glucose into two pyruvate molecules. It includes substrate-level phosphorylation and consists of three stages: energy-investment, lysis, and energy-conserving.
Energy-Investment Stage: ATP is used to phosphorylate glucose.
Lysis Stage: Glucose is split into two three-carbon molecules.
Energy-Conserving Stage: ATP and NADH are produced.
Other Pathways
Microbes may use alternative pathways for carbohydrate catabolism, such as the Pentose Phosphate Pathway and Entner-Doudoroff Pathway.
Pentose Phosphate Pathway: Produces precursor metabolites for nucleotide and amino acid synthesis.
Entner-Doudoroff Pathway: Used by certain bacteria, forms pyruvate via unique enzymes.
Respiration and Electron Transport Chain (ETC)
Aerobic and Anaerobic Respiration
Respiration involves the complete breakdown of organic energy sources. Aerobic respiration uses oxygen as the terminal electron acceptor, while anaerobic respiration uses alternatives such as nitrate or sulfate.
Aerobic Respiration: Yields about 38 ATP per glucose.
Anaerobic Respiration: Yields about 28 ATP per glucose.
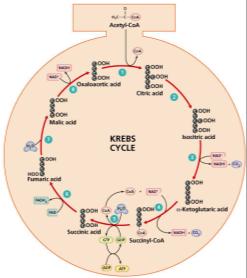
Stages: Pyruvate oxidation, Krebs cycle, Electron Transport Chain.
Electron Transport Chain and ATP Synthesis
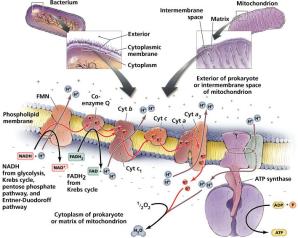
The ETC is a series of membrane-bound electron carriers that perform redox reactions, creating a proton gradient across the membrane. This gradient drives ATP synthesis via oxidative phosphorylation.
Proton Gradient: Established by pumping protons across the membrane.
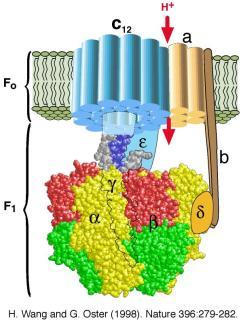
ATP Synthase: Uses proton motive force to phosphorylate ADP to ATP.
Oxidative Phosphorylation: ATP production driven by the proton gradient.
Fermentation
Fermentation Pathways
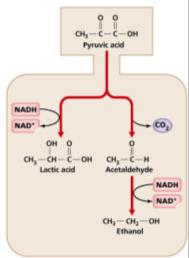
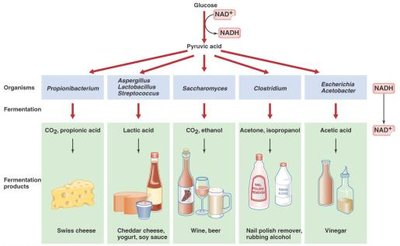
Fermentation provides cells with alternate sources of NAD+ by partially oxidizing sugar using an organic molecule as an electron acceptor. It is less efficient than respiration, yielding only 2 ATP per glucose.
Main Goal: Regenerate NAD+ for glycolysis.
Products: Species-specific wastes, some useful or harmful to humans.
Regulation of Metabolic Functions
Metabolic Regulation
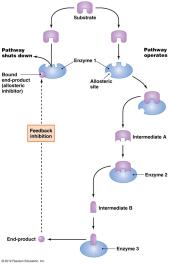
Cells regulate metabolism by synthesizing enzymes only when substrates are available, catabolizing the most energy-efficient substrate first, and using inhibitors to control enzyme activity. Eukaryotic cells isolate metabolic processes within organelles.
Genetic Control: Regulation at the genetic level.
Feedback Inhibition: End products inhibit pathway enzymes.
Compartmentalization: Eukaryotes isolate enzymes in organelles.
Anabolic Pathways
Biosynthesis of Macromolecules
Anabolic pathways synthesize essential macromolecules, including carbohydrates, lipids, amino acids, nucleotides, and photosynthetic products.
Carbohydrate Biosynthesis: Calvin-Benson cycle and gluconeogenesis.
Lipid Biosynthesis: Synthesized from glycerol and fatty acids.
Amino Acid Biosynthesis: Derived from precursor metabolites.
Nucleotide Biosynthesis: Ribose and deoxyribose from ribose-5 phosphate; purines and pyrimidines from amino acids.
Summary Table: Microbial Fermentation Products
The following table summarizes the annual market value and applications of some microbial fermentation products:
Production Group | 2003 Market Value (US$) | Applications |
|---|---|---|
L-Amino acids | > 2 billion | Nutrition, cattle feed, medicine |
Nucleotides (GMP+IMP) | 340 million | Nutrition |
Vitamin B12 | 75 million | Nutrition, medicine |
Citric acid and other organic acids | 1.5 billion | Nutrition, chemistry, electronic and other technology fields |
Antibiotics | 35 billion | Medicine (anti-infectives) |
Cyclosporin A | 1.5 billion | Medicine (organ transplants immunosuppressive agent) |
Statins | 15 billion | Medicine (cholesterol lowering agents) |
Avermectins | 1 billion | Veterinary medicine, agriculture (antiparasitic and insecticide) |
Bio-pesticides (Bt) | 125 million | Agriculture |
Industrial enzymes | 3-5 billion | Nutrition, chemistry, numerous industrial applications, biocatalysis |
rDNA peptides/proteins | 10 billion | Medicine |
Additional info: This table is inferred from the original content and provides a summary of the economic and practical importance of microbial fermentation products.
