Indietro
Microbial Metabolism: Principles and Applications
Guida di studio - Note intelligenti
 Appunti personalizzati basati sui tuoi materiali, ampliati con definizioni chiave, esempi e contesto.
Microbial Metabolism
Defining Metabolism
Metabolism encompasses all chemical reactions that organisms use to break down substances to release energy and to build new substances using that energy. These reactions are organized into biochemical pathways, which transform starting materials through intermediates to end products.
Metabolism: The sum of all chemical reactions in a cell.
Biochemical Pathways: Sequential steps converting substrates to products.
Catabolic, Anabolic, and Amphibolic Pathways
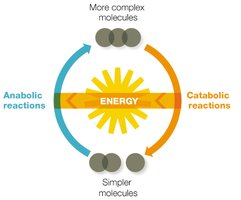
Metabolic pathways are classified as catabolic, anabolic, or amphibolic. Catabolic pathways break down molecules and release energy, while anabolic pathways build molecules and require energy. Amphibolic pathways serve both roles.
Catabolic Pathways: Hydrolytic, exergonic reactions (e.g., breakdown of sugars).
Anabolic Pathways: Biosynthetic, endergonic reactions (e.g., protein synthesis).
Amphibolic Pathways: Dual role in both breakdown and synthesis.
ATP: The Energy Currency
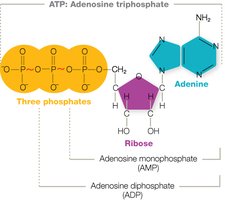
Adenosine triphosphate (ATP) is the primary energy molecule in cells. It is produced by catabolic reactions and used to power anabolic reactions. ATP consists of adenine, ribose, and three phosphate groups. The cycling between ATP and ADP is essential for energy transfer.
ATP Structure: Adenine, ribose, three phosphates.
ATP–ADP Cycling: Dephosphorylation releases energy; phosphorylation recharges ATP.
Equation:
Enzymes and Metabolic Regulation
General Features of Enzymes
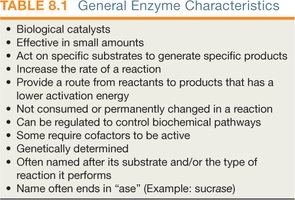
Enzymes are protein catalysts that accelerate chemical reactions without being consumed. They are essential for metabolism, lowering activation energy and ensuring reactions occur under cellular conditions.
Catalysts: Increase reaction rate, not consumed.
Specificity: Act on specific substrates.
Regulation: Can be controlled by cofactors, inhibitors, and genetic factors.
Enzyme Classification
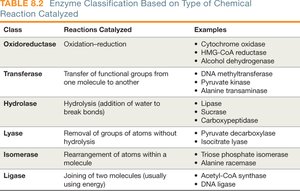
Enzymes are classified based on the type of reaction they catalyze, such as oxidoreductases, transferases, hydrolases, lyases, isomerases, and ligases.
Class | Reaction Catalyzed | Examples |
|---|---|---|
Oxidoreductase | Oxidation-reduction | Cytochrome oxidase, alcohol dehydrogenase |
Transferase | Transfer of functional groups | DNA methyltransferase |
Hydrolase | Hydrolysis | Lipase, sucrase |
Lyase | Removal of groups without hydrolysis | Pyruvate decarboxylase |
Isomerase | Rearrangement within a molecule | Triose phosphate isomerase |
Ligase | Joining two molecules | DNA ligase |
Enzyme-Substrate Interactions
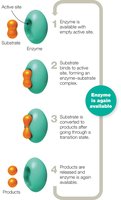
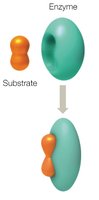
Enzymes bind substrates at the active site, forming an enzyme-substrate complex. The induced fit model describes how enzymes mold to substrates, facilitating the reaction.
Active Site: Region where substrate binds.
Induced Fit Model: Enzyme changes shape to accommodate substrate.
Enzyme Activity and Regulation
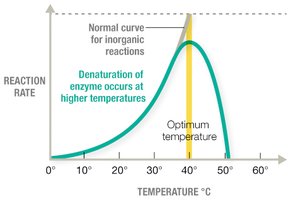
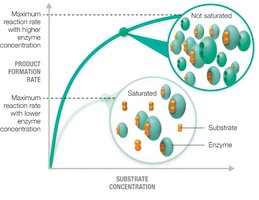
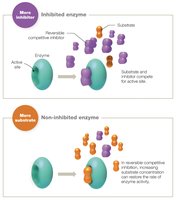
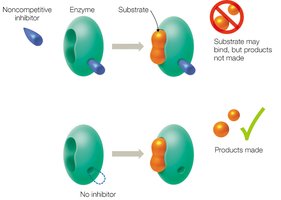
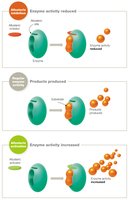
Enzyme activity is influenced by temperature, pH, substrate concentration, phosphorylation, and inhibitors. Enzymes can be competitively or noncompetitively inhibited, and regulated by allosteric effectors and feedback inhibition.
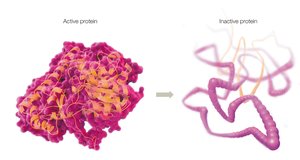
Temperature: Optimal range for activity; high temperatures denature proteins.
pH: Extreme pH disrupts bonds and denatures enzymes.
Substrate Concentration: Saturation affects reaction rate.
Phosphorylation: Kinases add, phosphatases remove phosphate groups.
Inhibition: Competitive (active site), noncompetitive (allosteric site).
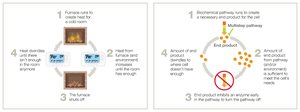
Feedback Inhibition: End product inhibits pathway.
Energy Production and Catabolic Pathways
Oxidation-Reduction (Redox) Reactions
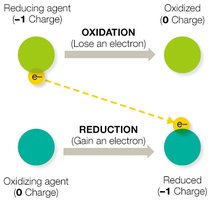
Cells extract energy from nutrients using redox reactions, where oxidation is the loss of electrons and reduction is the gain of electrons. These reactions are coupled and essential for ATP production.
Oxidizing Agent: Accepts electrons.
Reducing Agent: Donates electrons.
Cellular Respiration
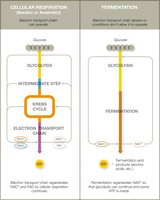
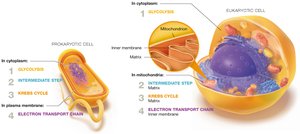
Cellular respiration is a multi-step process that extracts energy from carbohydrates. It includes glycolysis, the intermediate step, the Krebs cycle, and the electron transport chain.
Glycolysis: Glucose → 2 pyruvate, 2 ATP, 2 NADH
Intermediate Step: Pyruvate → 2 acetyl-CoA, 2 CO2
Krebs Cycle: Acetyl-CoA → 2 ATP, 6 NADH, 2 FADH2, 4 CO2
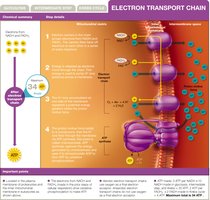
Electron Transport Chain: 32-34 ATP
Electron Transport Chain and Chemiosmosis
Electron transport chains transfer electrons through membrane-associated carriers, releasing energy to pump protons and create a proton motive force. ATP synthase uses this force to recharge ADP to ATP via chemiosmosis.
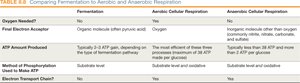
Aerobic Respiration: Oxygen is the final electron acceptor.
Anaerobic Respiration: Inorganic molecules (e.g., nitrate) are final electron acceptors.
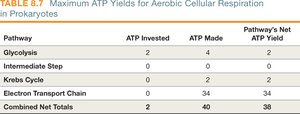
ATP Yield Comparison
Theoretical maximum ATP yield for aerobic respiration in prokaryotes is 38 ATP per glucose molecule.
Pathway | ATP Invested | ATP Made | Net ATP Yield |
|---|---|---|---|
Glycolysis | 2 | 4 | 2 |
Intermediate Step | 0 | 0 | 0 |
Krebs Cycle | 0 | 2 | 2 |
Electron Transport Chain | 0 | 34 | 34 |
Combined Net Totals | 2 | 40 | 38 |
Fermentation Pathways
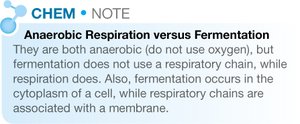
Fermentation allows cells to catabolize nutrients without a respiratory chain. It is less efficient than respiration and produces various end products.
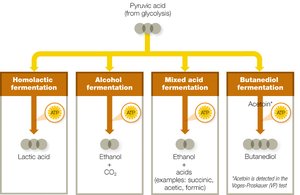
Lactic Acid Fermentation: Pyruvate → lactic acid
Alcohol Fermentation: Pyruvate → ethanol + CO2
Mixed Acid Fermentation: Pyruvate → acids + gases
Butanediol Fermentation: Pyruvate → butanediol + ethanol
Metabolic Diversity and Identification
Nutritional Patterns
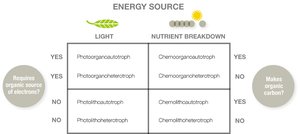
Organisms are categorized by how they obtain carbon and energy. Autotrophs fix carbon, heterotrophs require organic carbon. Lithotrophs use inorganic electron sources, organotrophs use organic sources. Phototrophs harvest light, chemotrophs harvest chemical energy.
Biochemical Tests for Microbial Identification
Biochemical tests exploit metabolic differences to identify microbes. Examples include amino acid catabolism tests, fermentation tests, oxidase and catalase tests, and rapid analysis techniques like API strips.
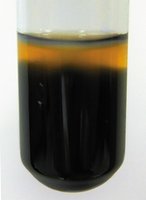
Amino Acid Catabolism: Detects deaminases, decarboxylases, sulfur reduction.
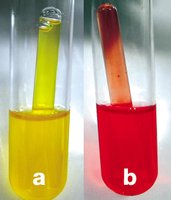
Fermentation Tests: Detects acid/gas production from carbohydrate fermentation.
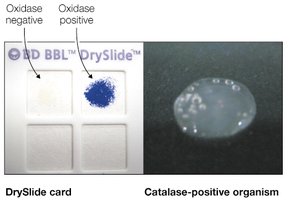
Oxidase/Catalase Tests: Detects presence of cytochrome c oxidase and catalase.
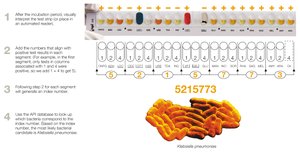
API System: Rapid identification using test strips.
Visual Summaries