 Indietro
Chapter 1: Foundations and Models in Microeconomics
Guida di studio - Note intelligenti
 Appunti personalizzati basati sui tuoi materiali, ampliati con definizioni chiave, esempi e contesto.
Economics: Foundations and Models
Three Key Economic Ideas
Economics is the study of how people make choices to attain their goals, given scarce resources. Three foundational ideas guide economic analysis:
People are rational: Individuals and firms use all available information to make decisions that maximize their objectives, such as profit or utility.
People respond to economic incentives: Changes in incentives alter behavior, as seen in policy impacts or market changes.
Optimal decisions are made at the margin: Most choices involve incremental changes, analyzed through marginal cost and marginal benefit. Marginal analysis compares these to determine optimal actions.
Scarcity and Choice
Scarcity arises because human wants exceed available resources. This forces individuals, firms, and societies to make choices and trade-offs.
Trade-off: Producing more of one good means producing less of another due to limited resources.
Opportunity cost: The value of the next-best alternative forgone when a choice is made.
The Economic Problem Every Society Must Solve
Every economy must answer three fundamental questions:
What goods and services will be produced? Choices reflect trade-offs and opportunity costs.
How will goods and services be produced? Firms select production methods based on costs and available technology.
Who will receive the goods and services produced? Distribution depends on income, government policy, and market mechanisms.
Types of Economic Systems
Centrally planned economy: The government allocates resources and makes production decisions.
Market economy: Households and firms interact in markets to allocate resources.
Mixed economy: Combines market mechanisms with significant government intervention.
Efficiency and Equity
Productive efficiency: Goods and services are produced at the lowest possible cost.
Allocative efficiency: Production aligns with consumer preferences; each good is produced up to the point where marginal benefit equals marginal cost.
Voluntary exchange: Transactions benefit both buyers and sellers.
Equity: Refers to the fair distribution of economic benefits, often requiring trade-offs with efficiency.
Economic Models
Economists use models—simplified representations of reality—to analyze economic situations and predict outcomes.
Steps in building a model:
Decide on assumptions.
Formulate a testable hypothesis.
Use data to test the hypothesis.
Revise the model if necessary.
Retain the model for future analysis.
Role of assumptions: Models require simplifications to be useful; behavioral assumptions are common (e.g., consumers maximize utility, firms maximize profit).
Positive vs. normative analysis:
Positive analysis: Concerned with what is (objective, fact-based).
Normative analysis: Concerned with what ought to be (subjective, value-based).
Microeconomics vs. Macroeconomics
Microeconomics: Studies individual households, firms, and markets.
Macroeconomics: Studies the economy as a whole, including aggregate measures like inflation, unemployment, and growth.
Economic Skills and Careers
Studying economics develops analytical skills valuable in business, government, and other fields. Economists analyze choices, predict consequences, and advise on better decision-making.
Important Economic Terms
Technology: The processes a firm uses to produce goods and services.
Capital: Manufactured goods used to produce other goods and services.
Appendix: Using Graphs and Formulas
Graphs in Economic Analysis
Graphs are essential tools for visualizing economic relationships and data.
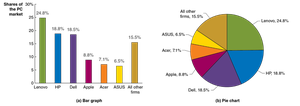
Bar graphs and pie charts: Used to represent market shares or proportions.
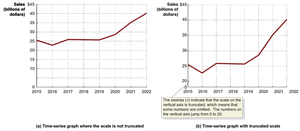
Time-series graphs: Show changes in variables over time, such as sales or loan amounts.
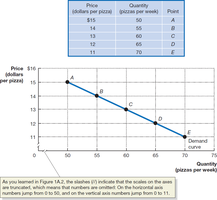
Plotting price and quantity: Used to illustrate demand curves and market relationships.
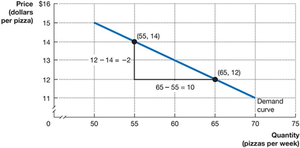
Calculating Slope
The slope of a line in economic graphs measures the rate of change between two variables.
Formula:
Example: If the price of pizza decreases from \frac{12-14}{65-55} = \frac{-2}{10} = -0.2$.
Nonlinear Relationships
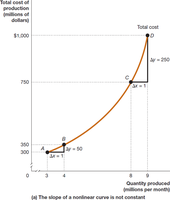
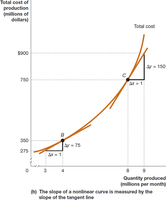
Many economic relationships are nonlinear, meaning the slope changes at different points.
Measuring slope: Use tangent lines or approximate over sections.
Example: Total cost curves for production.
Percentage Change Formula
Percentage change is used to measure growth or decline in economic variables.
Formula:
Example: U.S. real GDP increased from \frac{20,018 - 19,610}{19,610} \times 100 = 2.1\%$
Areas in Economic Graphs
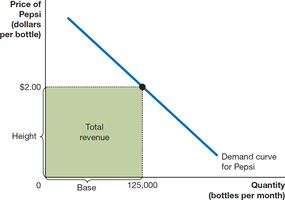
Rectangle area: Used to calculate total revenue ().
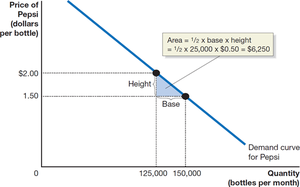
Triangle area: Used in consumer and producer surplus calculations ().
Summary of Using Formulas
Understand the economic concept represented by the formula.
Use the correct formula for the problem.
Check that the calculated value is economically reasonable.
Additional info:
Images included are directly relevant to the explanation of graphs, slopes, and areas in economic analysis.
All key terms and concepts are expanded for clarity and exam preparation.
