 Indietro
Consumer Choice and Behavioral Economics: Microeconomics Study Guide
Guida di studio - Note intelligenti
 Appunti personalizzati basati sui tuoi materiali, ampliati con definizioni chiave, esempi e contesto.
Consumer Choice and Behavioral Economics
Utility and Consumer Decision Making
Understanding how consumers make choices is central to microeconomics. Economists assume that consumers are rational and seek to maximize their utility, or satisfaction, given their limited resources.
Utility: The enjoyment or satisfaction received from consuming goods and services. Utility is not directly measurable, but it is a useful concept for analyzing consumer behavior.
Marginal Utility (MU): The additional utility gained from consuming one more unit of a good or service. In economics, "marginal" always means "additional."
Law of Diminishing Marginal Utility: As more units of a good are consumed, the additional satisfaction from each subsequent unit decreases.
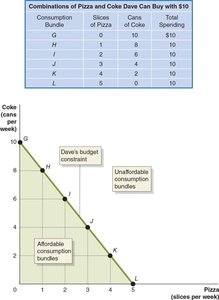
Budget Constraint: The limited amount of income available to consumers to spend on goods and services.
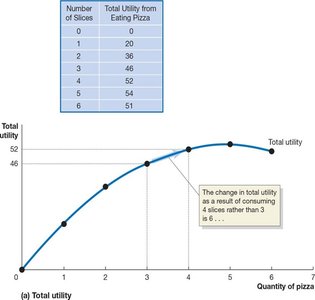
Example: The table and graph above show how total utility from eating pizza increases with each slice, but the increase slows and eventually turns negative, illustrating diminishing marginal utility.
Maximizing Utility: The Rule of Equal Marginal Utility per Dollar Spent
Consumers allocate their resources to maximize utility by equalizing the marginal utility per dollar spent across all goods.
Marginal Utility per Dollar: , where MU is marginal utility and P is price.
Utility Maximization Rule: Consumers should allocate their budget so that the marginal utility per dollar spent is equal for all goods:
Consumers should also exhaust their budget:
Spending on pizza + Spending on Coke = Budget
Effects of Price Changes: Income and Substitution Effects
When the price of a good changes, two effects influence consumer choice:
Income Effect: The change in quantity demanded resulting from a change in purchasing power due to a price change.
Substitution Effect: The change in quantity demanded resulting from a good becoming cheaper or more expensive relative to other goods.
Normal goods see increased consumption with higher income, while inferior goods see decreased consumption.
Where Demand Curves Come From
The law of demand states that as the price of a product falls, the quantity demanded increases. This is explained by the income and substitution effects.
The substitution effect makes the product relatively cheaper, increasing consumption.
The income effect increases purchasing power, also increasing consumption for normal goods.
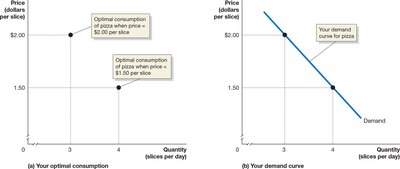
Example: The graph above shows how changes in price lead to changes in optimal consumption, tracing out the individual demand curve.
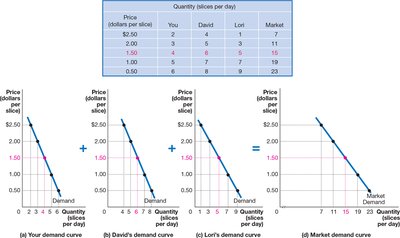
Market Demand: By summing individual demand curves at each price, we obtain the market demand curve.
Giffen Goods and Upward-Sloping Demand Curves
In rare cases, a demand curve may slope upward. This occurs when a good is inferior and constitutes a large portion of the consumer's budget, and the income effect outweighs the substitution effect. Such goods are called Giffen goods.

Example: In poor regions of China, a decrease in the price of rice led some consumers to buy less rice, as they could afford a more varied diet.
Social Influences on Decision Making
Consumer choices are often influenced by social factors, which standard economic models may overlook.
Celebrity Endorsements: Consumers may believe celebrities know more about products or aspire to be like them.
Network Externalities: The usefulness of a product increases as more people use it (e.g., social media platforms).
Fairness: People value fairness and may make choices that are not financially optimal to maintain fairness.

Example: Meta's virtual reality platform struggled to attract users due to network externalities; low user numbers reduced the product's value.
Experimental Economics and Fairness
Experimental economics uses laboratory experiments to study decision-making. Games like the ultimatum and dictator games reveal that people care about fairness.
Ultimatum Game: An allocator offers a split of money; the recipient can accept or reject. Offers perceived as unfair are often rejected.
Dictator Game: The recipient cannot reject; most allocators still choose fair splits.
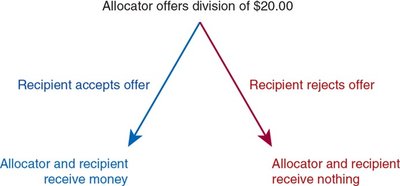
Business Implications of Fairness
Businesses often forego potential profits to maintain perceptions of fairness and customer loyalty. For example, concert ticket pricing strategies may prioritize fairness over maximizing revenue.


Example: Taylor Swift's "verified fan" ticketing system aimed to balance fairness and profit, reducing scalping and increasing fan satisfaction.
Behavioral Economics: Do People Make Rational Choices?
Behavioral economics studies situations where people do not act rationally according to traditional models. Common mistakes include:
Ignoring Nonmonetary Opportunity Costs: People often overlook nonmonetary costs, even though they are real opportunity costs.
Failing to Ignore Sunk Costs: Sunk costs should not affect future decisions, but people often let them influence their choices.
Being Unrealistic about Future Behavior: People may make decisions inconsistent with their long-term intentions.
Endowment Effect: People value items they own more than identical items they do not own, leading to reluctance to sell at market prices.
Nudges: Small changes in incentives or framing can significantly affect behavior, such as increasing retirement plan participation by changing default options.
Rules of Thumb and Anchoring
Consumers often use rules of thumb or are influenced by irrelevant information (anchoring) when making decisions.
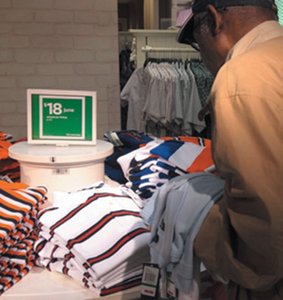
Example: Posting "limit 10 items per customer" can anchor consumers to buy more than they otherwise would.
Appendix: Indifference Curves and Budget Lines
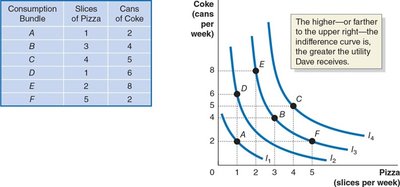
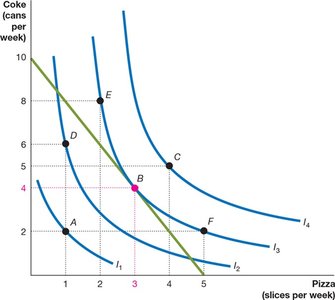
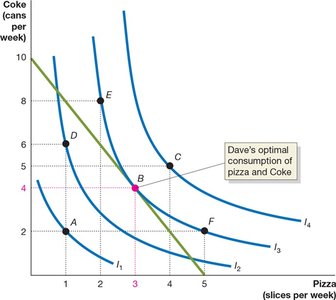
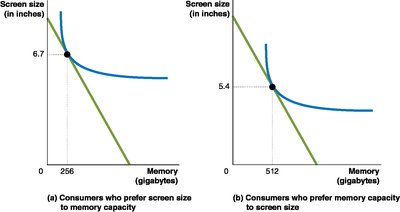
Indifference curves and budget lines are graphical tools used to analyze consumer behavior and optimal choices.
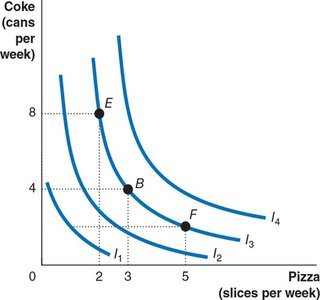
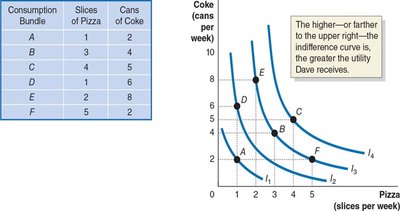
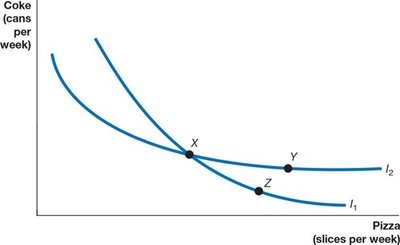
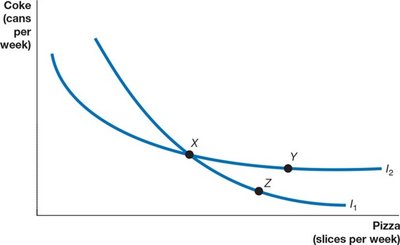
Indifference Curve: Shows combinations of goods that provide the same utility to the consumer.
Marginal Rate of Substitution (MRS): The rate at which a consumer is willing to trade one good for another while maintaining the same utility. It is the slope of the indifference curve.
Budget Line: Represents all combinations of goods a consumer can afford given their income and the prices of goods.
Effects of Price and Income Changes on Budget Constraints
Changes in price or income shift or rotate the budget constraint, affecting the consumer's optimal choice.
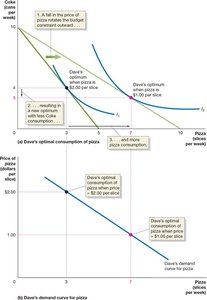
Income Effect: An increase in income shifts the budget constraint outward, allowing more consumption of both goods.
Substitution Effect: A decrease in the price of one good rotates the budget constraint outward along that axis, increasing consumption of the cheaper good.
Mathematical Relationships
Marginal Rate of Substitution:
Optimal Consumption Condition: At the optimum, the slope of the indifference curve equals the slope of the budget line:
Or rearranged:
Summary Table: Income and Substitution Effects
When price... | Consumer purchasing power... | Income effect (normal good) | Substitution effect |
|---|---|---|---|
decreases | increases | quantity demanded increases | opportunity cost decreases, quantity demanded increases |
increases | decreases | quantity demanded decreases | opportunity cost increases, quantity demanded decreases |
Additional info: The above table summarizes the effects of price changes on consumer behavior for normal goods. For inferior goods, the income effect may work in the opposite direction.
