 Indietro
Consumer Preferences and Indifference Curves in Microeconomics
Guida di studio - Note intelligenti
 Appunti personalizzati basati sui tuoi materiali, ampliati con definizioni chiave, esempi e contesto.
Consumer Behavior and Preferences
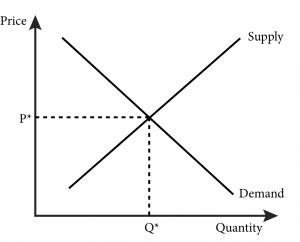
Neoclassical Partial Equilibrium Framework
The neoclassical framework in microeconomics analyzes how consumers and producers interact in markets to determine equilibrium prices and quantities. Consumers aim to maximize their utility given their preferences and budget constraints, while producers maximize profit given their technology and cost structures.
Consumers: Maximize utility, subject to budget constraints, resulting in a demand curve.
Producers: Maximize profit, subject to technology and cost curves, resulting in a supply curve.
Market Equilibrium: Determined by the intersection of supply and demand, setting price and quantity.
Principles of Consumer Theory
Consumer theory predicts how individuals make choices about allocating their limited income among various goods. Two key principles guide this behavior:
Optimization Principle: Individuals choose the best bundle of goods they can afford, maximizing utility.
Equilibrium Principle: The actions of all consumers must be consistent, leading to market equilibrium.
Preferences and Utility
Preferences and Ranking Bundles
Preferences reflect the satisfaction or utility a consumer derives from consuming goods and services. Economists assume that consumers rank bundles of goods according to the pleasure they provide.
Strict Preference (≻): Bundle X is preferred to Bundle Y.
Weak Preference (≿): Bundle X is at least as preferred as Bundle Y.
Indifference (~): Bundles X and Y are equally preferred.
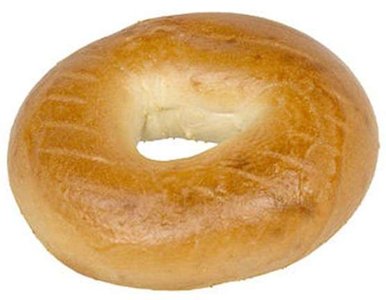

Preference Relationships
When comparing two consumption bundles, consumers use strict, weak, or indifferent preferences to rank them. This ranking forms the basis for constructing indifference curves.
Indifference Curves
Definition and Properties
An indifference curve shows all combinations of two goods that provide the consumer with the same level of satisfaction. Moving along the curve illustrates the trade-offs a consumer is willing to make between the goods while maintaining constant utility.
Each curve corresponds to a specific utility level; higher curves represent higher satisfaction.
If bundle A contains more of all goods than bundle B, then A ≻ B (more is better).
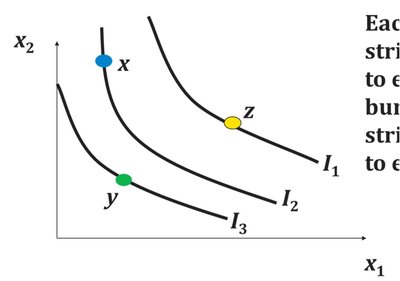
Drawing Indifference Curves
Indifference curves can be drawn through specific bundles to reflect consumer preferences. For example, bundles of coffee and bagels can be ranked and plotted to illustrate the consumer's indifference curves.
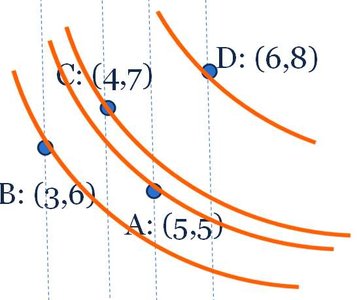
Properties of Indifference Curves
Indifference curves possess several important properties:
Every bundle lies on an indifference curve.
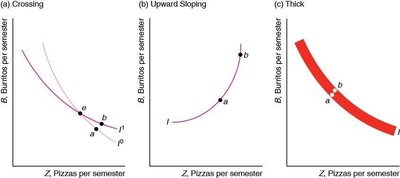
Indifference curves cannot slope upward.
Indifference curves cannot cross.
Indifference curves cannot be thick.
Bundles on curves farther from the origin are preferred.
Rational Preferences
Preferences are considered rational if they satisfy:
Completeness: Any two bundles can be compared.
Transitivity: If X ≿ Y and Y ≿ Z, then X ≿ Z.
Monotonicity: More is better, either strongly or weakly.
Marginal Rate of Substitution (MRS)
Definition and Calculation
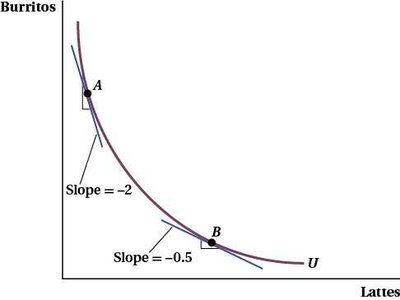
The Marginal Rate of Substitution (MRS) is the rate at which a consumer is willing to give up one good for an additional unit of another good, keeping utility constant. It is represented by the slope of the indifference curve.
Formula:
High MRS: Consumer values x1 more, curve is steeper.
Low MRS: Consumer values x1 less, curve is flatter.

Diminishing Marginal Rate of Substitution
As a consumer moves down an indifference curve, the MRS typically diminishes, reflecting a decreasing willingness to trade one good for another as the quantity of the first good increases.
Extreme Indifference Curves
Perfect Substitutes
For perfect substitutes, the consumer is willing to trade one good for another at a constant rate, regardless of the quantities held. The indifference curve is a straight line with constant slope (constant MRS).
Example: Trading 12-oz bags for 3-oz bags of chips at a fixed ratio.
Perfect Complements
For perfect complements, the consumer prefers to consume goods in fixed proportions. The indifference curve is L-shaped, and additional units of one good do not increase satisfaction unless matched by the other.
Example: Right and left shoes; satisfaction only increases with pairs.
Other Indifference Curves
Other cases include "bads" (undesirable goods) or situations where "more is better" does not hold, such as a preference for balanced consumption bundles.
Summary Table: Properties of Indifference Curves
Property | Description |
|---|---|
Every bundle lies on a curve | All possible bundles are represented |
No upward slope | Curves always slope downward or are flat |
No crossing | Curves cannot intersect |
No thickness | Curves are lines, not areas |
Farther curves preferred | Curves farther from origin represent higher utility |
Practice Question
Hot Dogs and Hot Dog Buns
An individual's indifference curve for hot dogs and hot dog buns is most likely:
L-shaped (Perfect complements)
Downward sloping straight line (Perfect substitutes)
Bended toward the origin (Typical well-behaved curve)
Correct answer: L-shaped, since hot dogs and buns are typically consumed in pairs.
Conclusion
Understanding consumer preferences and indifference curves is fundamental to microeconomics. These concepts help explain how individuals make choices, how markets reach equilibrium, and how the value of goods is determined through trade-offs and utility maximization.
