Indietro
Consumers, Producers, and the Efficiency of Markets: Welfare Economics in Microeconomics
Guida di studio - Note intelligenti
 Appunti personalizzati basati sui tuoi materiali, ampliati con definizioni chiave, esempi e contesto.
Chapter 7: Consumers, Producers, and the Efficiency of Markets
Introduction to Welfare Economics
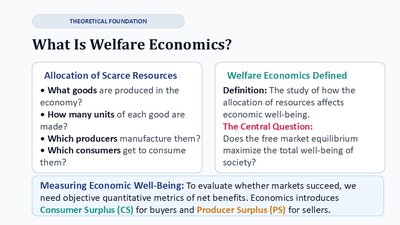
Welfare economics studies how the allocation of resources affects economic well-being. It provides tools to evaluate whether markets succeed in maximizing total societal welfare by introducing quantitative metrics such as Consumer Surplus (CS) and Producer Surplus (PS).
Allocation of Scarce Resources: What goods are produced, how much, by whom, and for whom?
Central Question: Does the free market equilibrium maximize total well-being?
Consumer Surplus
Willingness to Pay (WTP)
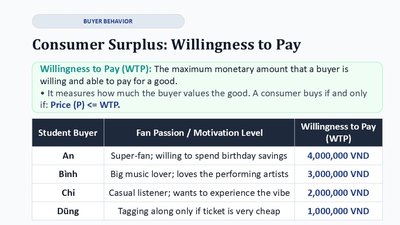
Willingness to Pay (WTP) is the maximum amount a buyer is willing and able to pay for a good. A consumer will only purchase if the price is less than or equal to their WTP.
Measures how much the buyer values the good.
CS arises when WTP exceeds the actual price paid.
Student Buyer | Fan Passion / Motivation Level | Willingness to Pay (VND) |
|---|---|---|
An | Super-fan; willing to spend birthday savings | 4,000,000 |
Binh | Big music lover; loves the performing artists | 3,000,000 |
Chi | Casual listener; wants to experience the vibe | 2,000,000 |
Dũng | Tagging along only if ticket is very cheap | 1,000,000 |
WTP and the Demand Schedule
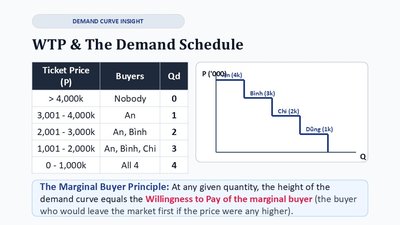
The demand schedule shows the relationship between ticket price and the number of buyers. The Marginal Buyer Principle states that at any quantity, the height of the demand curve equals the WTP of the marginal buyer (the buyer who would leave the market if the price were any higher).
Ticket Price (P) | Buyers | Qd |
|---|---|---|
> 4,000k | Nobody | 0 |
3,001 - 4,000k | An | 1 |
2,001 - 3,000k | An, Binh | 2 |
1,001 - 2,000k | An, Binh, Chi | 3 |
0 - 1,000k | All 4 | 4 |
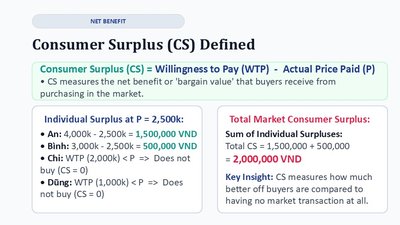
Consumer Surplus (CS) Defined
Consumer Surplus (CS) is defined as:
Measures the net benefit or 'bargain value' buyers receive from purchasing in the market.
For each buyer, CS is positive only if WTP > P.
Example Calculation at P = 2,500k VND:
An: 4,000k - 2,500k = 1,500,000 VND
Binh: 3,000k - 2,500k = 500,000 VND
Chi: 2,000k < 2,500k (does not buy, CS = 0)
Dũng: 1,000k < 2,500k (does not buy, CS = 0)
Total Market CS: 1,500,000 + 500,000 = 2,000,000 VND
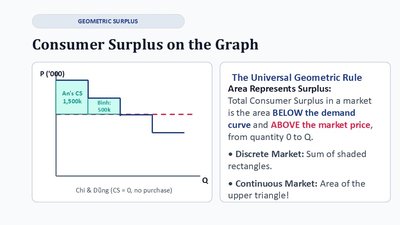
Consumer Surplus on the Graph
Total Consumer Surplus in a market is the area below the demand curve and above the market price, from quantity 0 to Q.
Discrete Market: Sum of shaded rectangles.
Continuous Market: Area of the upper triangle.
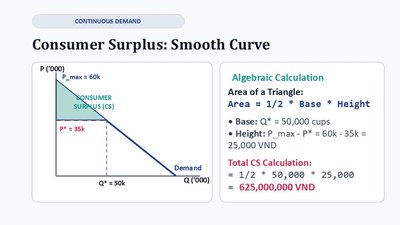
Consumer Surplus: Smooth Curve
For a linear demand curve, CS is the area of a triangle:
Base: units
Height: VND
Total CS: VND
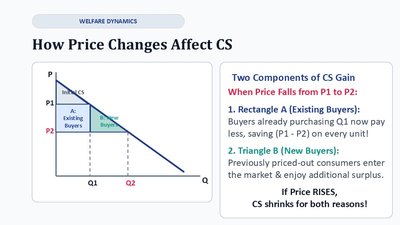
How Price Changes Affect Consumer Surplus
When price falls from to :
Rectangle A (Existing Buyers): Buyers already purchasing now pay less, gaining extra surplus.
Triangle B (New Buyers): New buyers enter the market, gaining surplus.
If price rises, CS shrinks for both reasons.
Producer Surplus
Opportunity Cost & Willingness to Sell
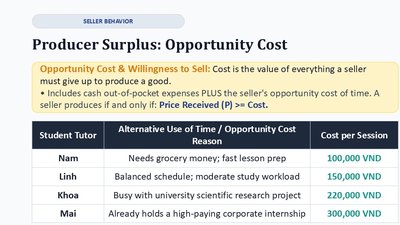
Opportunity Cost is the value of everything a seller must give up to produce a good, including both explicit and implicit costs. Willingness to Sell is the minimum price a seller will accept, equal to their opportunity cost.
Student Tutor | Alternative Use of Time / Opportunity Cost Reason | Cost per Session (VND) |
|---|---|---|
Nam | Needs grocery money; fast lesson prep | 100,000 |
Linh | Balanced schedule; moderate study workload | 150,000 |
Khoa | Busy with university research project | 220,000 |
Mai | Already holds a high-paying internship | 300,000 |
Cost and the Supply Schedule
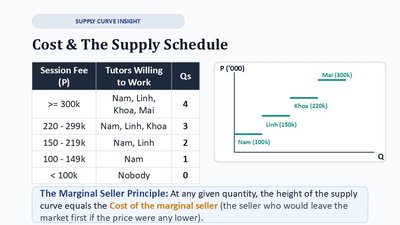
The supply schedule shows the relationship between session fee and the number of tutors willing to work. The Marginal Seller Principle states that at any quantity, the height of the supply curve equals the cost of the marginal seller (the seller who would leave the market if the price were any lower).
Session Fee (P) | Tutors Willing to Work | Qs |
|---|---|---|
>= 300k | Nam, Linh, Khoa, Mai | 4 |
220 - 299k | Nam, Linh, Khoa | 3 |
150 - 219k | Nam, Linh | 2 |
100 - 149k | Nam | 1 |
< 100k | Nobody | 0 |
Producer Surplus (PS) Defined
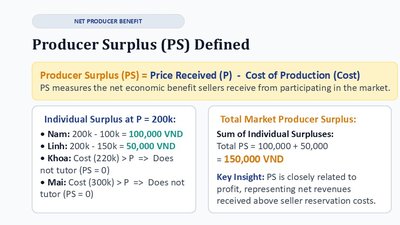
Producer Surplus (PS) is defined as:
Measures the net economic benefit sellers receive from participating in the market.
For each seller, PS is positive only if P > Cost.
Example Calculation at P = 200k VND:
Nam: 200k - 100k = 100,000 VND
Linh: 200k - 150k = 50,000 VND
Khoa: 200k < 220k (does not tutor, PS = 0)
Mai: 200k < 300k (does not tutor, PS = 0)
Total Market PS: 100,000 + 50,000 = 150,000 VND
Producer Surplus: Smooth Curve
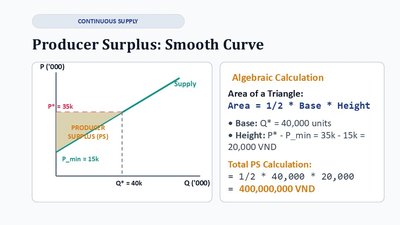
For a linear supply curve, PS is the area of a triangle:
Base: units
Height: VND
Total PS: VND
Market Equilibrium and Surplus Calculation
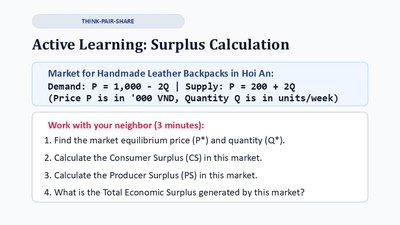
Active Learning: Surplus Calculation
Given demand and supply equations for handmade leather backpacks in Hoi An:
Demand:
Supply:
Tasks:
Find market equilibrium price () and quantity ().
Calculate Consumer Surplus (CS).
Calculate Producer Surplus (PS).
Calculate Total Economic Surplus.
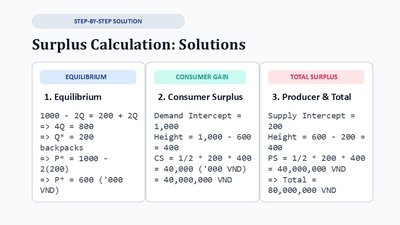
Step-by-Step Solution
Equilibrium: ,
Consumer Surplus: Intercept = 1,000, Height = 1,000 - 600 = 400, CS = ('000 VND)
Producer Surplus: Intercept = 200, Height = 600 - 200 = 400, PS = ('000 VND)
Total Surplus: 80,000 ('000 VND)
Total Surplus and Market Efficiency
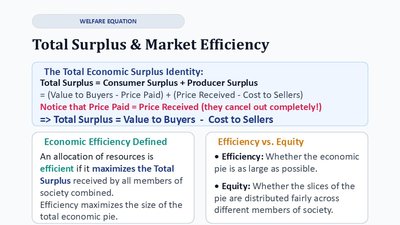
Total Surplus & Market Efficiency
Total Economic Surplus is the sum of consumer and producer surplus:
Economic efficiency is achieved when total surplus is maximized.
Efficiency vs. Equity: Efficiency maximizes the size of the economic pie; equity concerns how the pie is divided.
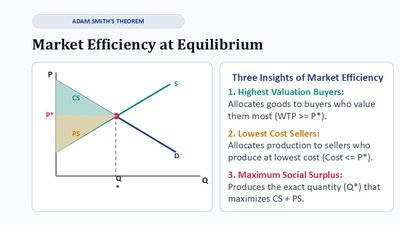
Market Efficiency at Equilibrium
Goods are allocated to buyers who value them most (highest WTP).
Production is allocated to sellers with the lowest cost.
Market equilibrium quantity () maximizes total surplus.
Proofs of Market Efficiency
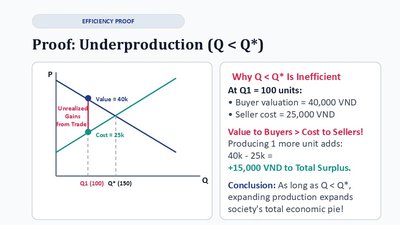
Underproduction ()
Value to buyers > cost to sellers for additional units.
Producing more increases total surplus.
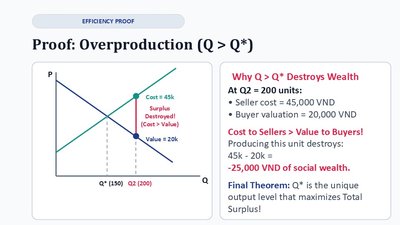
Overproduction ()
Cost to sellers > value to buyers for extra units.
Producing more reduces total surplus (destroys wealth).
The Social Planner vs. The Market
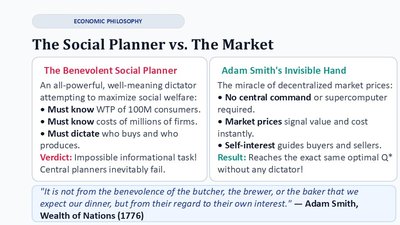
Central planners would need impossible amounts of information to maximize social welfare. In contrast, decentralized markets use prices to allocate resources efficiently, guided by the 'invisible hand' (Adam Smith).
No central command is needed; market prices signal value and cost instantly.
Self-interest guides buyers and sellers to the optimal outcome.
Market Failures
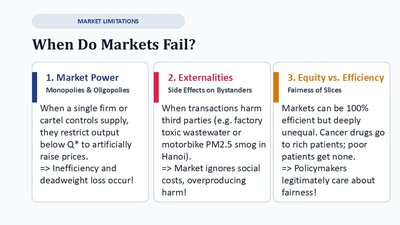
Market Power: Monopolies and oligopolies can restrict output and raise prices, causing inefficiency and deadweight loss.
Externalities: Side effects on bystanders (e.g., pollution) are ignored by the market, leading to overproduction or underproduction.
Equity vs. Efficiency: Markets can be efficient but not equitable; policymakers may intervene for fairness.
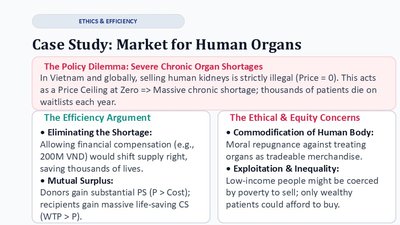
Case Study: Market for Human Organs
Strict price ceilings (e.g., price = 0 for kidneys) create chronic shortages. Allowing compensation could eliminate shortages and increase total surplus, but raises ethical concerns about commodification and inequality.
Efficiency Argument: Compensation increases supply and mutual surplus.
Ethical Concerns: Commodification, exploitation, and inequality.
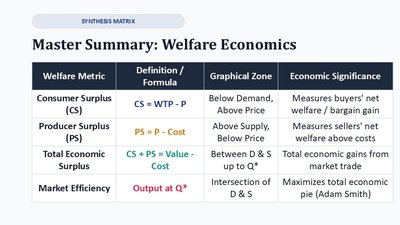
Master Summary: Welfare Economics
Welfare Metric | Definition / Formula | Graphical Zone | Economic Significance |
|---|---|---|---|
Consumer Surplus (CS) | CS = WTP - P | Below Demand, Above Price | Measures buyers' net welfare / bargain gain |
Producer Surplus (PS) | PS = P - Cost | Above Supply, Below Price | Measures sellers' net welfare above costs |
Total Economic Surplus | CS + PS = Value - Cost | Between D & S up to Q* | Total economic gains from market trade |
Market Efficiency | Output at Q* | Intersection of D & S | Maximizes total economic pie (Adam Smith) |
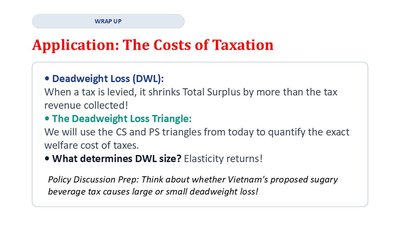
Application: The Costs of Taxation
Deadweight Loss (DWL): When a tax is levied, it shrinks total surplus by more than the tax revenue collected. The deadweight loss triangle quantifies the welfare cost of taxes. The size of DWL depends on the elasticity of supply and demand.
Elasticity determines how much quantity shrinks in response to a tax.