 Indietro
Chapter 3 Demand and Supply: Foundations of Market Equilibrium
Guida di studio - Note intelligenti
 Appunti personalizzati basati sui tuoi materiali, ampliati con definizioni chiave, esempi e contesto.
Demand and Supply
Introduction to Competitive Markets
A competitive market is one in which many buyers and sellers interact, and no single participant can influence the market price. In such markets, the price acts as an opportunity cost, guiding the allocation of resources. Understanding how prices are determined and how they change is central to microeconomics.
The Law of Demand
The law of demand states that, other things remaining the same, the higher the price of a good, the lower the quantity demanded; conversely, the lower the price, the higher the quantity demanded. This relationship can be expressed as:
Substitution Effect: When the price of a good rises, consumers seek substitutes, reducing the quantity demanded.
Income Effect: A higher price reduces consumers' purchasing power, also decreasing quantity demanded.
The demand curve graphically represents this inverse relationship between price and quantity demanded.
Demand Curve
The demand curve is a downward-sloping line on a graph where the vertical axis represents price and the horizontal axis represents quantity demanded. Each point on the curve shows the quantity consumers are willing to buy at a specific price.
Example:
If the price of energy bars decreases, the quantity demanded increases, as shown by a movement along the demand curve.
Changes in Demand
A change in demand refers to a shift of the entire demand curve, caused by factors other than the good's own price. The main factors that shift demand are:
Prices of related goods (substitutes and complements)
Expected future prices
Income
Expected future income and credit
Population
Preferences
When demand increases, the curve shifts rightward; when it decreases, the curve shifts leftward.
Types of Goods
Normal Good: Demand increases as income rises.
Inferior Good: Demand decreases as income rises.
Substitute Goods: Goods that can replace each other; an increase in the price of one increases demand for the other.
Complement Goods: Goods consumed together; an increase in the price of one decreases demand for the other.
The Law of Supply
The law of supply states that, other things remaining the same, the higher the price of a good, the greater the quantity supplied; the lower the price, the smaller the quantity supplied. This relationship can be written as:
As price increases, quantity supplied increases.
As price decreases, quantity supplied decreases.
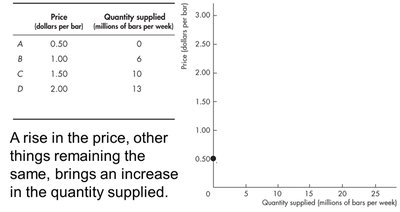
Supply Curve
The supply curve is an upward-sloping line on a graph where the vertical axis represents price and the horizontal axis represents quantity supplied. Each point shows the quantity producers are willing to sell at a specific price.
Changes in Supply
A change in supply refers to a shift of the entire supply curve, caused by factors other than the good's own price. The main factors that shift supply are:
Prices of factors of production
Prices of related goods produced
Expected future prices
Number of suppliers
Technology
State of nature
Market Equilibrium
Market equilibrium occurs when the quantity demanded equals the quantity supplied at a particular price. The equilibrium price is where the plans of buyers and sellers match, and the equilibrium quantity is the amount bought and sold at this price.
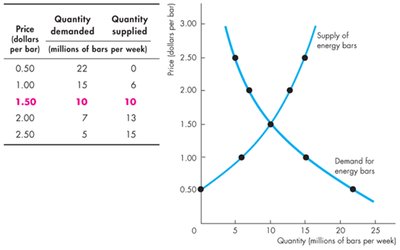
Example:
At a price of $1.50 per energy bar, the quantity demanded and supplied are both 10 million bars per week, indicating equilibrium.
Surplus and Shortage
Surplus: Occurs when quantity supplied exceeds quantity demanded at a given price, causing downward pressure on price.
Shortage: Occurs when quantity demanded exceeds quantity supplied at a given price, causing upward pressure on price.
Example Table:
Price (dollars per unit) | Quantity Demanded (units) | Quantity Supplied (units) |
|---|---|---|
1 | 1,100 | 50 |
2 | 800 | 200 |
3 | 600 | 420 |
4 | 500 | 500 |
5 | 420 | 580 |
6 | 350 | 640 |
7 | 320 | 680 |
8 | 300 | 700 |
At $2, there is a shortage; at $7, there is a surplus; at $4, the market is in equilibrium.
Shifts in Demand and Supply
Changes in demand or supply shift the respective curves, altering equilibrium price and quantity:
Increase in demand: Raises both equilibrium price and quantity.
Decrease in demand: Lowers both equilibrium price and quantity.
Increase in supply: Lowers equilibrium price, raises equilibrium quantity.
Decrease in supply: Raises equilibrium price, lowers equilibrium quantity.
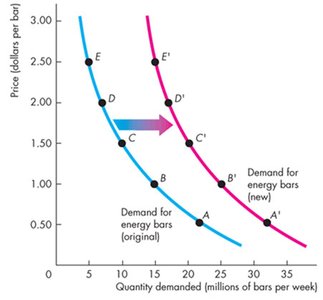
Example:
If income increases and the good is normal, demand shifts right, increasing price and quantity. If the good is inferior, demand shifts left, decreasing price and quantity.
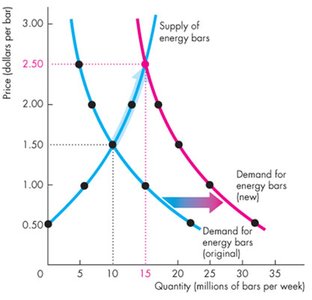
Mathematical Representation of Equilibrium
Equilibrium can be found by setting the demand and supply equations equal to each other:
Suppose demand:
Supply:
At equilibrium, and
Set equations equal and solve for and :
Key Concepts Summary
Law of demand and supply
Demand and supply curves
Shifts vs. movements along curves
Factors affecting demand and supply
Market equilibrium, surplus, and shortage
Normal, inferior, substitute, and complement goods
Practice Problems
What happens to equilibrium price and quantity if both demand and supply increase?
How does a rise in the price of a substitute good affect the demand curve?
Given and , what is the equilibrium price and quantity?
Additional info: This guide expands on the provided notes with definitions, examples, and equations for clarity and completeness.
