 Indietro
Demand, Supply, and Market Equilibrium: Microeconomics Study Guide
Guida di studio - Note intelligenti
 Appunti personalizzati basati sui tuoi materiali, ampliati con definizioni chiave, esempi e contesto.
Firms and Households: The Basic Decision-Making Units
Definitions and Roles
In microeconomics, firms and households are the fundamental decision-making units. Firms produce goods and services to meet demand, while households consume these goods and supply inputs such as labor, capital, and land.
Firm: An organization that produces goods or services to meet perceived demand.
Entrepreneur: The individual who organizes, manages, and assumes the risks of a firm.
Households: The consuming units in an economy.
Input Markets and Output Markets: The Circular Flow
Market Types and Flow of Economic Activity
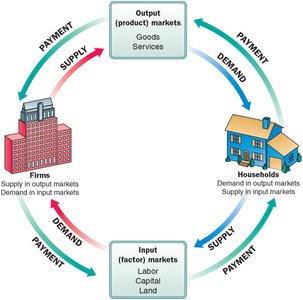
Microeconomics distinguishes between product/output markets (where goods and services are exchanged) and input/factor markets (where resources like labor, capital, and land are exchanged). The circular flow diagram illustrates the movement of goods, services, and payments between firms and households.
Labor market: Households supply labor for wages to firms.
Capital market: Households supply savings for interest or future profits to firms.
Land market: Households supply land or property for rent.
Factors of production: Land, labor, and capital.
Demand in Product/Output Markets
Determinants of Demand
A household’s decision about how much of a product to demand depends on several factors:
The price of the product
Household income
Accumulated wealth
Prices of other products
Tastes and preferences
Expectations about future income, wealth, and prices
Quantity Demanded and the Law of Demand
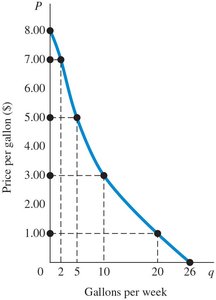
Quantity demanded is the amount of a product a household would buy at a given price. The law of demand states that, ceteris paribus, as price rises, quantity demanded falls; as price falls, quantity demanded rises.
Demand schedule: Table showing quantities demanded at various prices.
Demand curve: Graph showing the relationship between price and quantity demanded.
Shifts vs. Movements Along the Demand Curve
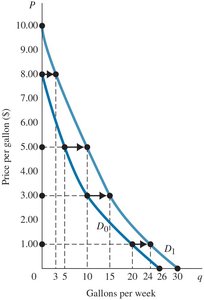
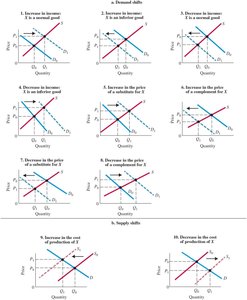
A movement along the demand curve is caused by a change in the price of the good. A shift of the demand curve occurs when other factors (income, preferences, prices of other goods) change.
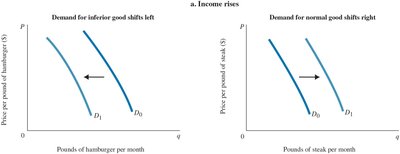
Normal goods: Demand increases as income rises.
Inferior goods: Demand decreases as income rises.
Substitutes: Goods that can replace each other; demand for one increases as the price of the other rises.
Complements: Goods that are used together; demand for one increases as the price of the other falls.
Supply in Product/Output Markets
Determinants of Supply
Firms supply goods and services based on the potential for profit, which is the difference between revenues and costs. The quantity supplied is the amount a firm is willing to sell at a given price.
Supply schedule: Table showing quantities supplied at various prices.
Supply curve: Graph showing the relationship between price and quantity supplied.
Law of supply: As price rises, quantity supplied rises; as price falls, quantity supplied falls.
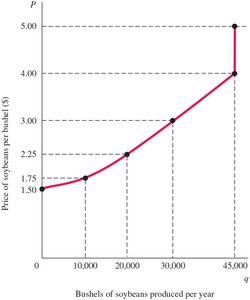
Shifts vs. Movements Along the Supply Curve
A movement along the supply curve is caused by a change in the price of the good. A shift of the supply curve occurs when other factors (input prices, technology, prices of related goods) change.
Change in price leads to movement along the curve.
Change in costs, input prices, or technology leads to a shift of the curve.
From Individual to Market Supply
Market Supply Curve
The market supply is the sum of all quantities supplied by all firms at each price. It is derived by horizontally summing individual supply curves.
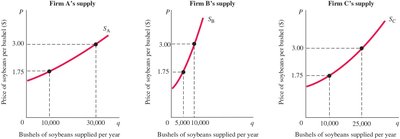
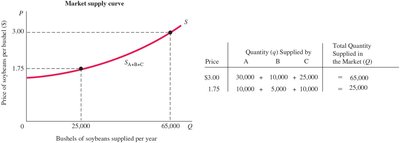
Market Equilibrium
Equilibrium, Excess Demand, and Excess Supply
Market equilibrium occurs when quantity supplied equals quantity demanded. At this point, there is no tendency for price to change. If quantity demanded exceeds quantity supplied, there is excess demand (shortage), causing price to rise. If quantity supplied exceeds quantity demanded, there is excess supply (surplus), causing price to fall.
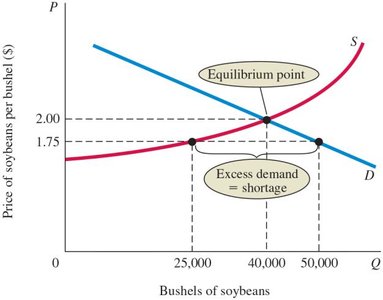
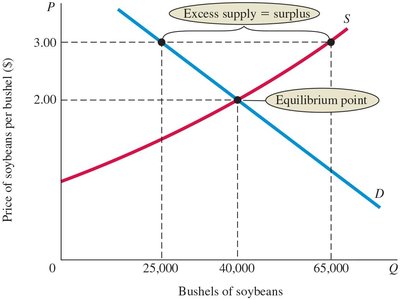
Market Equilibrium with Equations
Mathematical Representation
Economists use equations to represent demand and supply:
Inverse demand curve:
Demand curve:
Inverse supply curve:
Supply curve:
Equilibrium: Set and solve for and
Example:
Set :
Solve for :
Substitute back:
Changes in Equilibrium
Effects of Shifts in Supply and Demand
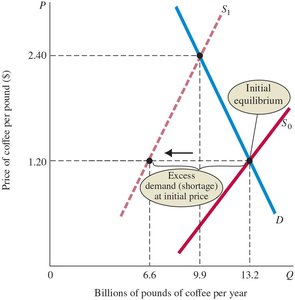
When supply or demand curves shift, the equilibrium price and quantity change. For example, a decrease in supply (such as a freeze in the coffee market) increases equilibrium price and decreases equilibrium quantity.
Markets and the Allocation of Resources
How Markets Answer Economic Questions
Markets allocate resources by determining what is produced, how it is produced, and who receives the products. Demand curves reflect willingness and ability to pay, influenced by incomes, wealth, preferences, and expectations. Firms seek profit by choosing efficient technologies. Prices adjust to balance supply and demand, ensuring resources are allocated efficiently.
