 Indietro
Foundations of Microeconomics: Key Concepts, Models, and Graphical Analysis
Guida di studio - Note intelligenti
 Appunti personalizzati basati sui tuoi materiali, ampliati con definizioni chiave, esempi e contesto.
Economics: Foundations and Models
What Is Economics?
Economics is the study of how individuals, firms, and governments make choices to allocate scarce resources in order to satisfy unlimited wants. Scarcity forces decision-makers to evaluate trade-offs and opportunity costs. Economists use economic models—simplified representations of reality—to analyze these choices and predict outcomes.
Three Key Economic Ideas
People Are Rational: Individuals make decisions to maximize their satisfaction, using all available information to weigh costs and benefits. Rationality does not guarantee perfection, but it implies systematic decision-making.
People Respond to Incentives: Changes in costs or benefits influence behavior. For example, lower taxes may encourage more consumption, while higher costs may deter certain actions.
Optimal Decisions Are Made at the Margin: Most choices involve small adjustments. Marginal analysis compares the additional benefit (marginal benefit, MB) to the additional cost (marginal cost, MC) of an action. Decisions are optimal when MB = MC.
Basic Economic Problems
Questions Every Economy Must Answer
What goods and services will be produced? Societies must decide how to allocate resources among competing uses. The concept of opportunity cost—the value of the next best alternative forgone—is central to these decisions.
How will goods and services be produced? Firms choose production methods based on resource costs, technology, and efficiency. They may substitute labor with capital or relocate production to minimize costs.
Who will receive the goods and services? Distribution depends largely on income, which is influenced by market outcomes and government policies such as taxation and transfers.
Types of Economic Systems
Centrally Planned, Market, and Mixed Economies
Centrally Planned Economy: The government makes all allocation decisions.
Market Economy: Households and firms interact in markets to allocate resources.
Mixed Economy: Most decisions are made in markets, but the government plays a significant role in resource allocation (e.g., public goods, regulation).
Efficiency and Equity
Productive and Allocative Efficiency
Productive Efficiency: Goods and services are produced at the lowest possible cost, typically due to competition.
Allocative Efficiency: Resources are allocated according to consumer preferences, achieved through voluntary exchange.
Equity: Refers to the fair distribution of economic benefits. There is often a trade-off between efficiency and equity, as policies that promote fairness may reduce incentives and efficiency.
Microeconomics vs. Macroeconomics
Scope and Examples
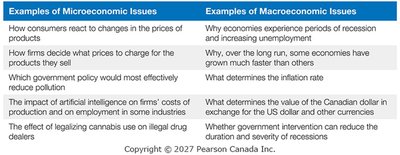
Microeconomics studies the behavior of individual households and firms, market interactions, and the effects of government policies on these agents. Macroeconomics examines the economy as a whole, focusing on aggregate outcomes such as inflation, unemployment, and economic growth.
Examples of Microeconomic Issues | Examples of Macroeconomic Issues |
|---|---|
How consumers react to changes in the prices of products | Why economies experience periods of recession and increasing unemployment |
How firms decide what prices to charge for the products they sell | Why, over the long run, some economies have grown much faster than others |
Which government policy would most effectively reduce pollution | What determines the inflation rate |
The impact of artificial intelligence on firms' costs of production and on employment in some industries | What determines the value of the Canadian dollar in exchange for the US dollar or other currencies |
The effect of legalizing cannabis use on illegal drug dealers | Whether government intervention can reduce the duration and severity of recessions |
Economic Models and the Scientific Method
Building and Testing Economic Models
Models are simplified frameworks that focus on key variables and relationships.
Steps in model building:
Decide on assumptions.
Formulate a testable hypothesis.
Use data to test the hypothesis.
Revise the model if necessary.
Retain the model for future analysis if it performs well.
Models can be expressed mathematically, graphically, or verbally.
Positive vs. Normative Analysis
Positive Analysis: Objective statements based on facts and logic ("what is").
Normative Analysis: Subjective statements based on value judgments ("what ought to be").
Economic Terminology
Key Terms
Technology: The processes a firm uses to turn inputs into outputs.
Capital: Durable manufactured goods used to produce other goods and services.
Graphical Models in Economics
Using Graphs to Represent Economic Relationships
Graphs are essential tools for visualizing economic models and relationships. They help clarify how variables interact and allow for easier interpretation of data and trends.
Types of Graphs
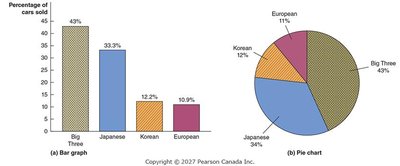
Bar Graphs and Pie Charts: Used to display categorical data, such as market shares.
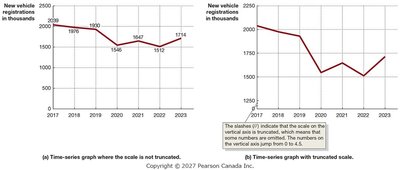
Time-Series Graphs: Show how a variable changes over time. The choice of scale can affect the visual interpretation of trends.
Plotting Economic Data
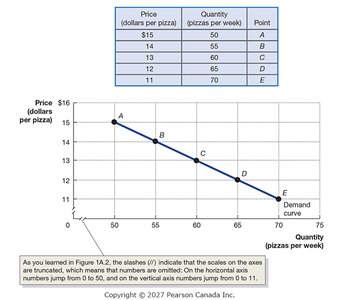
Graphs often plot two variables, such as price and quantity. Each point represents a combination of these variables, and connecting the points can illustrate relationships like demand curves.
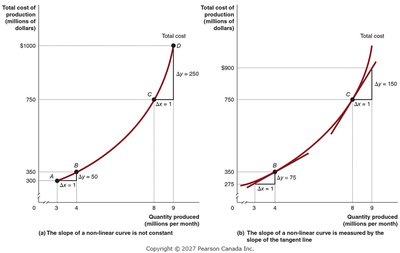
Calculating Slope
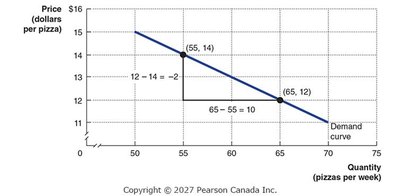
The slope of a line on a graph is calculated as the change in the y-axis variable divided by the change in the x-axis variable:
Shifting Curves and Multiple Variables
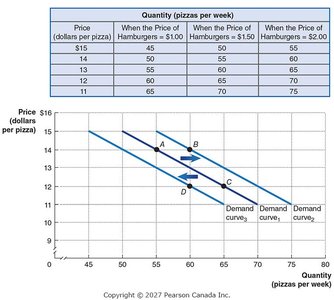
Economic graphs can show how changes in a third variable (e.g., the price of a related good) shift the entire curve, such as the demand curve for pizza shifting when the price of hamburgers changes.
Positive and Negative Relationships
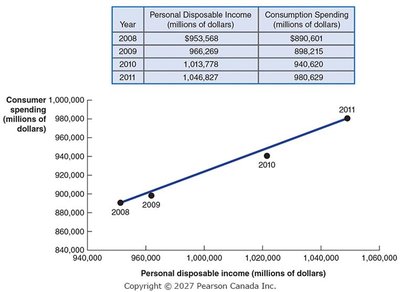
A positive relationship means both variables move in the same direction; a negative relationship means they move in opposite directions. For example, higher disposable income typically leads to higher consumption spending.
Cause and Effect in Graphs
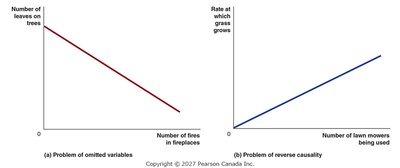
Graphs can illustrate relationships but do not always prove causality. Problems such as omitted variables or reverse causality can lead to incorrect conclusions.
Linear vs. Non-Linear Relationships
Many economic relationships are non-linear, meaning the slope changes at different points. Linear approximations are often used for simplicity, but real-world data may require more complex analysis.
Percentage Change Formula
The percentage change in a variable is calculated as:
Areas Under Curves: Total Revenue and Surplus
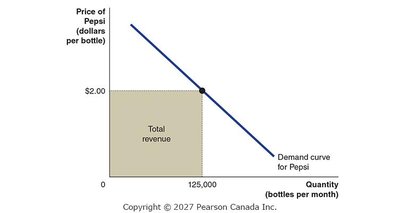
Area of a Rectangle: Used to calculate total revenue (price × quantity).
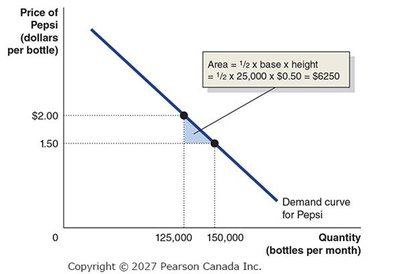
Area of a Triangle: Used to calculate consumer or producer surplus.
Additional info: These foundational concepts and graphical tools are essential for understanding more advanced topics in microeconomics, such as supply and demand, elasticity, and market structures.
