Indietro
International Trade: Comparative Advantage, Welfare, and Policy Debates
Guida di studio - Note intelligenti
 Appunti personalizzati basati sui tuoi materiali, ampliati con definizioni chiave, esempi e contesto.
Chapter 9: Application — International Trade
Overview
This chapter explores the microeconomic foundations of international trade, focusing on comparative advantage, the welfare effects of exporting and importing, and the policy debates surrounding tariffs, quotas, and trade restrictions.
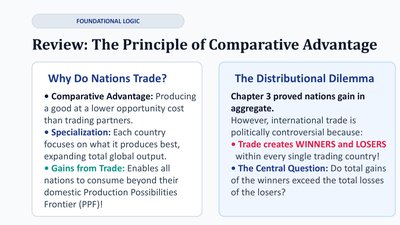
Principle of Comparative Advantage
Why Do Nations Trade?
Comparative Advantage: A country has a comparative advantage if it can produce a good at a lower opportunity cost than its trading partners.
Specialization: Each country specializes in producing goods where it has a comparative advantage, increasing total global output.
Gains from Trade: Trade allows all nations to consume beyond their domestic Production Possibilities Frontier (PPF).
The Distributional Dilemma
Trade creates winners and losers within each trading country.
The central question: Do total gains to winners exceed the total losses of losers?
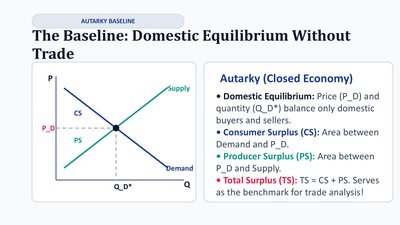
Domestic Equilibrium Without Trade (Autarky)
Autarky (Closed Economy)
Domestic Equilibrium: The price (P_D) and quantity (Q_D*) where domestic supply equals domestic demand.
Consumer Surplus (CS): Area between demand curve and price.
Producer Surplus (PS): Area between price and supply curve.
Total Surplus (TS): ; serves as the benchmark for trade analysis.
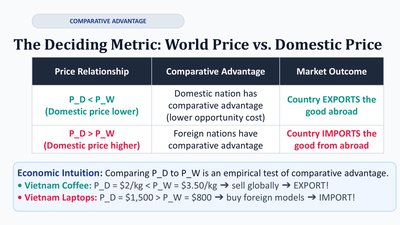
World Price vs. Domestic Price: The Deciding Metric
Comparative Advantage and Market Outcome
Price Relationship | Comparative Advantage | Market Outcome |
|---|---|---|
P_D < P_W (Domestic price lower) | Domestic nation has comparative advantage | Country EXPORTS the good abroad |
P_D > P_W (Domestic price higher) | Foreign nations have comparative advantage | Country IMPORTS the good from abroad |
Economic Intuition: Comparing P_D to P_W tests for comparative advantage.
Example: Vietnam exports coffee (P_D < P_W), imports laptops (P_D > P_W).
Analytical Tool: The Small Economy Assumption
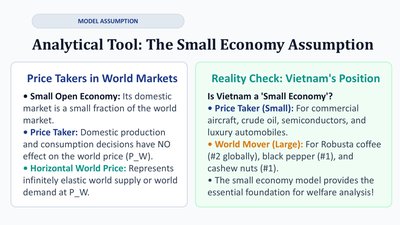
Price Takers in World Markets
Small Open Economy: Domestic market is a small fraction of the world market.
Price Taker: Domestic decisions do not affect the world price (P_W).
Horizontal World Price: World price is constant for the small economy.
Reality Check: Vietnam's Position
Vietnam is a price taker for most goods, but a world mover for some (e.g., coffee, black pepper).
Case 1: An Exporting Country (P_W > P_D)
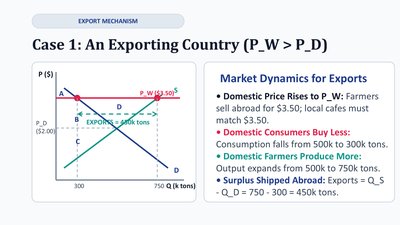
Market Dynamics for Exports
Domestic price rises to P_W; local producers sell abroad at higher prices.
Domestic consumers buy less due to higher prices.
Domestic producers increase output; surplus is exported.
Example Calculation: If Q_D = 300, Q_S = 750, exports = 450 units.
Welfare in an Exporting Nation: Winners and Losers
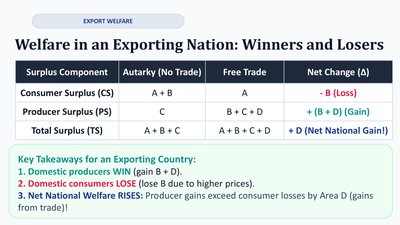
Surplus Component | Autarky (No Trade) | Free Trade | Net Change (Δ) |
|---|---|---|---|
Consumer Surplus (CS) | A + B | A | -B (Loss) |
Producer Surplus (PS) | C | B + C + D | + (B + D) (Gain) |
Total Surplus (TS) | A + B + C | A + B + C + D | + D (Net National Gain!) |
Domestic producers win (gain B + D).
Domestic consumers lose (lose B).
Net national welfare rises (gains from trade = area D).
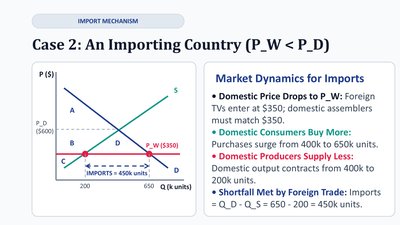
Case 2: An Importing Country (P_W < P_D)
Market Dynamics for Imports
Domestic price drops to P_W; foreign goods enter the market.
Domestic consumers buy more due to lower prices.
Domestic producers supply less; imports fill the gap.
Example Calculation: If Q_D = 650, Q_S = 200, imports = 450 units.
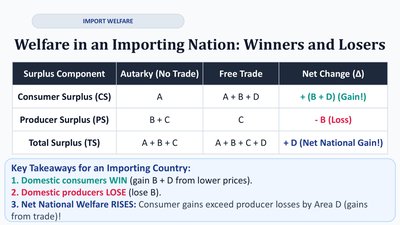
Welfare in an Importing Nation: Winners and Losers
Surplus Component | Autarky (No Trade) | Free Trade | Net Change (Δ) |
|---|---|---|---|
Consumer Surplus (CS) | A | A + B + D | + (B + D) (Gain!) |
Producer Surplus (PS) | B + C | C | - B (Loss) |
Total Surplus (TS) | A + B + C | A + B + C + D | + D (Net National Gain!) |
Domestic consumers win (gain B + D).
Domestic producers lose (lose B).
Net national welfare rises (gains from trade = area D).
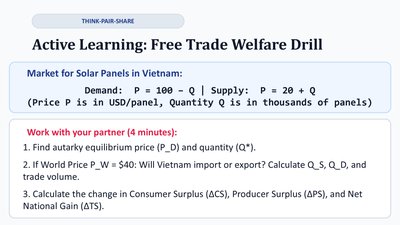
Worked Example: Free Trade Welfare Drill
Market for Solar Panels in Vietnam
Demand:
Supply:
Find autarky equilibrium, determine import/export status at , and calculate welfare changes.
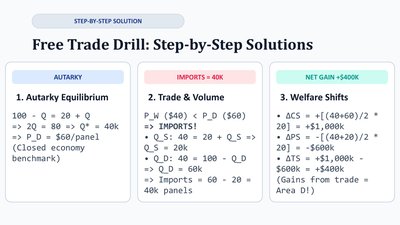
Step-by-Step Solutions
Autarky Equilibrium:
Imports: ; imports =
Welfare Shifts:
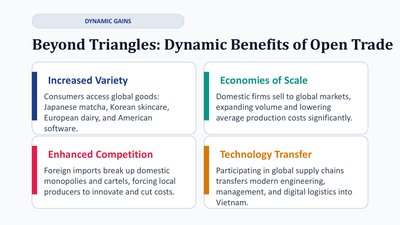
Dynamic Benefits of Open Trade
Increased Variety: Access to a wider range of goods and services.
Economies of Scale: Larger markets allow firms to lower average costs.
Enhanced Competition: Foreign competition drives innovation and efficiency.
Technology Transfer: Participation in global supply chains spreads modern techniques and management.
The Political Economy of Trade
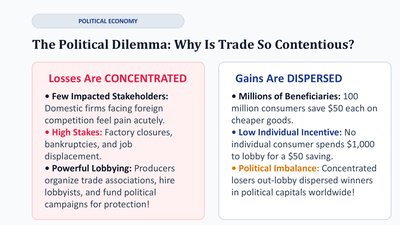
Why Is Trade So Contentious?
Losses Are Concentrated: A few stakeholders (e.g., domestic firms) face large, visible losses.
Gains Are Dispersed: Many consumers benefit, but each gains only a little.
Powerful Lobbying: Producers organize to protect their interests.
Political Imbalance: Concentrated losers out-lobby dispersed winners.
Trade Barriers: Tariffs
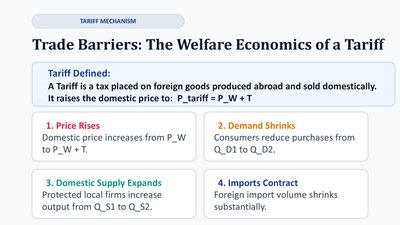
The Welfare Economics of a Tariff
Tariff: A tax on imported goods, raising the domestic price to .
Effects:
Price rises
Demand shrinks
Domestic supply expands
Imports contract
Welfare Anatomy: Deconstructing the Tariff Graph
Area | Economic Meaning | Recipient |
|---|---|---|
-(C+D+E+F) | Consumer Surplus Loss | Domestic Consumers |
+C | Producer Surplus Gain | Protected Local Firms |
+E | Tariff Revenue (T × Imports) | Government Treasury |
D + F | Deadweight Loss (DWL) | Lost to Society |
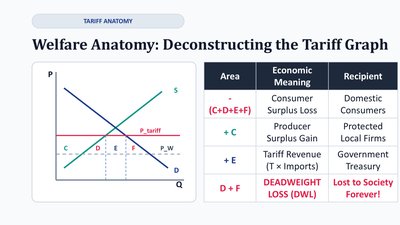
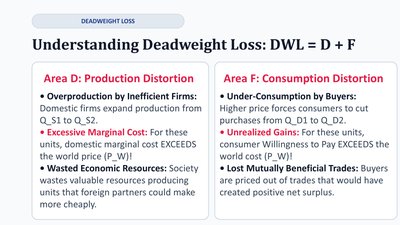
Understanding Deadweight Loss: DWL = D + F
Area D: Production Distortion
Overproduction by inefficient firms; excessive marginal cost.
Wasted resources: Domestic production exceeds world cost.
Area F: Consumption Distortion
Under-consumption by buyers; higher prices reduce purchases.
Lost mutually beneficial trades; unrealized gains.
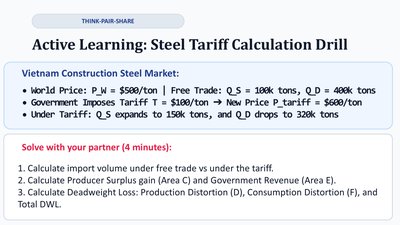
Worked Example: Steel Tariff Calculation Drill
World Price:
Free Trade: ,
Tariff: ,
Under Tariff: ,
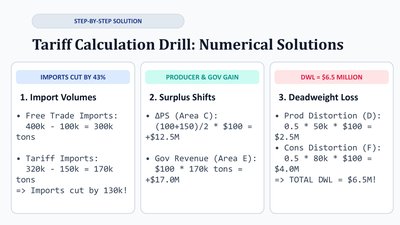
Numerical Solutions
Import Volumes: Imports cut by 43% (from 300k to 170k tons).
Surplus Shifts: Producer surplus gain = $12.5M; government revenue = $17M.
Deadweight Loss: (production + consumption distortion).
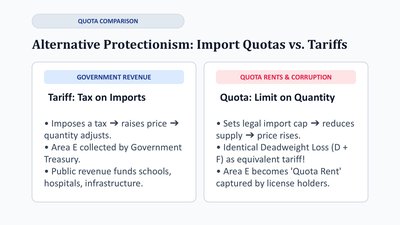
Import Quotas vs. Tariffs
Tariff: Tax on Imports | Quota: Limit on Quantity |
|---|---|
Imposes a tax, raises price, quantity adjusts; revenue to government | Sets legal import cap, raises price, identical DWL, quota rents to license holders |
Both create deadweight loss (D + F), but quota rents go to license holders, not the government.
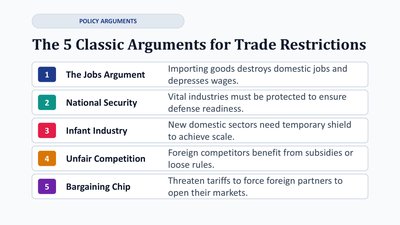
Policy Arguments for Trade Restrictions
The Jobs Argument: Imports destroy domestic jobs and lower wages.
National Security: Protect vital industries for defense readiness.
Infant Industry: New sectors need temporary protection to achieve scale.
Unfair Competition: Foreign competitors may benefit from subsidies or loose rules.
Bargaining Chip: Threaten tariffs to force foreign partners to open markets.
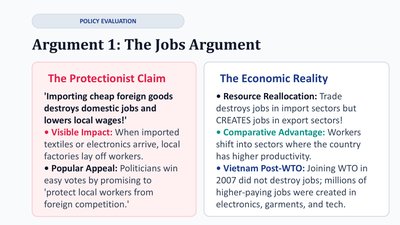
Policy Evaluation: The Jobs Argument
Protectionist Claim: Imports destroy jobs and lower wages.
Economic Reality: Trade reallocates jobs to sectors with comparative advantage; overall employment is not reduced.
Example: Vietnam's WTO accession did not destroy jobs; higher-paying jobs were created in new sectors.
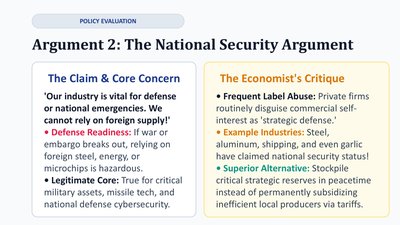
Policy Evaluation: The National Security Argument
Claim: Some industries are vital for defense and emergencies.
Economist's Critique: Label often abused for commercial interests; better to stockpile critical reserves than subsidize inefficient production.
Example: Steel, aluminum, shipping, and even garlic have claimed national security status.