 Indietro
Introduction to Microeconomics: Scarcity, Opportunity Cost, and Demand
Guida di studio - Note intelligenti
 Appunti personalizzati basati sui tuoi materiali, ampliati con definizioni chiave, esempi e contesto.
Introduction to Microeconomics
What is Economics?
Economics is the study of how individuals and societies allocate scarce resources to satisfy unlimited wants. The fundamental problem of scarcity arises because resources are limited, but human wants are infinite.
Scarcity: The inability to have everything we want due to limited resources.
Microeconomics: The branch of economics that studies the choices of individuals and businesses, their interactions in markets, and the influence of governments.
Key Questions:
What is produced, how is it produced, and for whom?
When do choices made in self-interest also promote social interest?
Factors of Production
Resources used to produce goods and services are called factors of production. Each earns a specific type of income:
Land: Earns rent
Labor: Earns wages
Capital: Earns interest
Enterprise (Entrepreneurship): Earns profit
Economic Thinking
Opportunity Cost: The highest-valued alternative forgone when a choice is made.
Choosing at the Margin: Decisions made by comparing additional benefits and additional costs of a little more or a little less of an activity.
Marginal Benefit (MB): The benefit from an incremental increase in an activity.
Marginal Cost (MC): The opportunity cost of an incremental increase in an activity.
Trade-offs: Every choice involves giving up one thing to get something else.
Rational Choices: Choices that compare costs and benefits to achieve the greatest benefit and satisfy preferences.
Incentives: Rewards or penalties that encourage or discourage actions. Changes in incentives predict changes in choices.
Self-Interest and Social Interest
Self-interest: Choices made for personal benefit.
Social interest: Choices that benefit society as a whole.
Efficiency: Resource use is efficient if it is not possible to make someone better off without making someone else worse off.
Equity: Fairness in the distribution of resources, though definitions of fairness vary among economists.
Introductory Economic Models
Production Possibilities Frontier (PPF)
The Production Possibilities Frontier (PPF) is a model that shows the maximum combinations of goods and services that can be produced with available resources and technology.
Points on the PPF: Efficient production
Points inside the PPF: Attainable but inefficient
Points outside the PPF: Unattainable
Every choice along the PPF involves a trade-off between goods.
Using Resources Efficiently
Marginal Cost (MC): The opportunity cost of producing one more unit of a good or service.
Marginal Benefit (MB): The benefit received from consuming one more unit, measured by willingness to pay.
Principle of Decreasing Marginal Benefit: As more of a good is consumed, the marginal benefit decreases.
Allocative Efficiency
Production Efficiency: Achieved when it is not possible to produce more of one good without producing less of another (any point on the PPF).
Allocative Efficiency: Achieved when resources are allocated so that marginal benefit equals marginal cost ().
Gains from Trade
Comparative Advantage: The ability to perform an activity at a lower opportunity cost than others.
Absolute Advantage: The ability to produce more of a good or service with the same amount of resources than others.
Supply and Demand
Competitive Markets
A competitive market is one with many buyers and sellers, so no single participant can influence the price.
Money Price: The amount of money exchanged for a good or service.
Relative Price: The price of one good in terms of another; also represents opportunity cost.
Demand
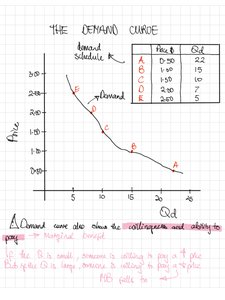
The law of demand states that, other things remaining the same, the higher the price of a good, the smaller the quantity demanded; the lower the price, the greater the quantity demanded.
Quantity Demanded (Qd): The amount consumers plan to buy at a given price during a specific period.
Demand: The entire relationship between the price of a good and the quantity demanded.
Demand Curve: A graphical representation of the relationship between price and quantity demanded, holding other factors constant.
Why the Law of Demand?
Substitution Effect: When the price of a good rises, its opportunity cost increases, leading consumers to substitute other goods, decreasing quantity demanded.
Income Effect: When the price of a good rises and income remains unchanged, consumers cannot afford as much, so quantity demanded decreases.
Changes in Quantity Demanded vs. Changes in Demand
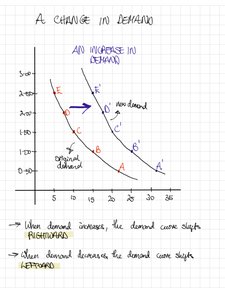
Change in Quantity Demanded: Movement along the demand curve due to a change in price.
Change in Demand: A shift of the entire demand curve due to factors other than price.
Factors Affecting Demand
Prices of Related Goods:
Substitutes: Goods that can replace each other. An increase in the price of one increases demand for the other.
Complements: Goods used together. An increase in the price of one decreases demand for the other.
Expected Future Prices: If consumers expect prices to rise, current demand increases.
Income:
Normal Goods: Demand increases as income increases.
Inferior Goods: Demand decreases as income increases.
Expected Future Income and Credit: Higher expected income or easier credit increases current demand.
Population: Larger population increases demand for all goods.
Preferences: Changes in tastes and preferences can increase or decrease demand.
Shifts in the Demand Curve
When demand increases, the demand curve shifts rightward.
When demand decreases, the demand curve shifts leftward.
Mathematical Representation
The demand function can be expressed as:
Where is quantity demanded, is price, is the intercept, and is the slope of the demand curve.
Additional info: The images provided reinforce the graphical understanding of the demand curve and shifts in demand, which are central to microeconomic analysis of markets.
