 Indietro
Microeconomics: Demand, Supply, and Equilibrium (Chapter 4, Part 2)
Guida di studio - Note intelligenti
 Appunti personalizzati basati sui tuoi materiali, ampliati con definizioni chiave, esempi e contesto.
Demand, Supply, and Equilibrium
Introduction
This section explores the core concepts of microeconomics related to market equilibrium, focusing on how demand and supply interact to determine prices and quantities in competitive markets. It also examines the effects of government intervention and simultaneous shifts in demand and supply.
Review of Demand and Supply Curves
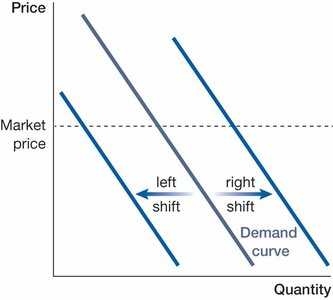
Shifts in the Demand Curve
The demand curve shows the relationship between the price of a good and the quantity demanded, holding all else equal (ceteris paribus).
Factors that shift the demand curve:
Tastes and preferences
Income and wealth
Availability and prices of related goods (substitutes and complements)
Number and scale of buyers
Buyers’ expectations about the future
Movement along the demand curve: Caused only by a change in the product’s own price, typically due to a shift in the supply curve.
Shifts in the Supply Curve
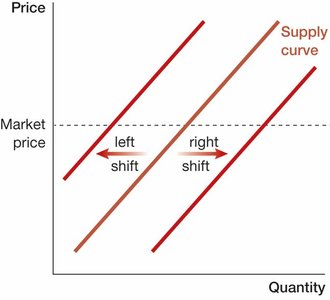
The supply curve shows the relationship between the price of a good and the quantity supplied, holding all else equal.
Factors that shift the supply curve:
Input prices
Technology
Number and scale of sellers
Sellers’ expectations about the future
Movement along the supply curve: Caused only by a change in the product’s own price, typically due to a shift in the demand curve.
Holding All Else Equal (Ceteris Paribus)
Definition: The assumption that all other variables except the one under consideration are held constant.
Application: When analyzing movements along a curve, all other determinants are assumed constant except price.
Market Equilibrium
Competitive Equilibrium
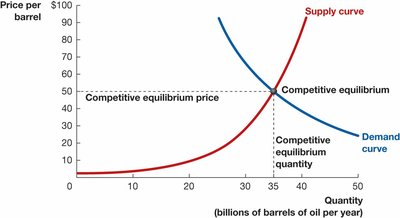
Competitive equilibrium is the point at which the market comes to an agreement about price and quantity exchanged. At this point, the quantity demanded equals the quantity supplied.
Equilibrium price (p*): The price at which quantity demanded equals quantity supplied.
Equilibrium quantity (q*): The quantity bought and sold at the equilibrium price.
Process of Reaching Equilibrium
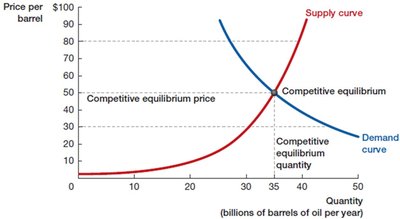
When the price is too high, quantity supplied exceeds quantity demanded, leading to excess supply (surplus). Sellers lower prices to clear inventories.
When the price is too low, quantity demanded exceeds quantity supplied, leading to excess demand (shortage). Buyers bid up prices.
At equilibrium, there is no incentive for buyers or sellers to change their behavior.
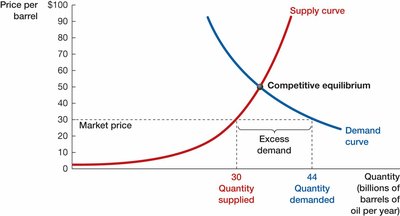
Disequilibrium: Excess Supply and Excess Demand
Excess Supply (Surplus): Occurs when quantity supplied > quantity demanded at a given price. Leads to downward pressure on price.
Excess Demand (Shortage): Occurs when quantity demanded > quantity supplied at a given price. Leads to upward pressure on price.
Shifts in Supply and Demand: Effects on Equilibrium
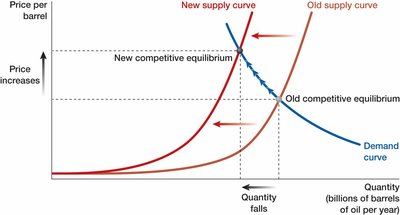
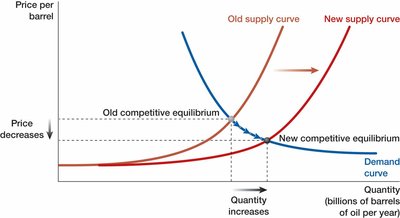
Supply Curve Shifts
Leftward shift: Decreases supply, raises equilibrium price, lowers equilibrium quantity.
Rightward shift: Increases supply, lowers equilibrium price, raises equilibrium quantity.
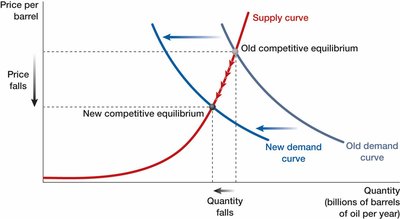
Demand Curve Shifts
Leftward shift: Decreases demand, lowers both equilibrium price and quantity.
Rightward shift: Increases demand, raises both equilibrium price and quantity.
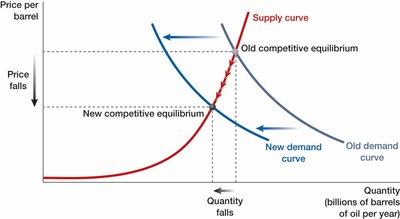
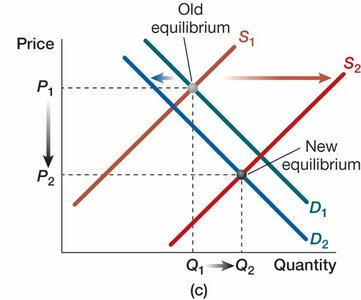
Simultaneous Shifts in Supply and Demand
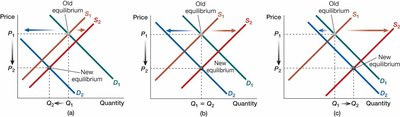
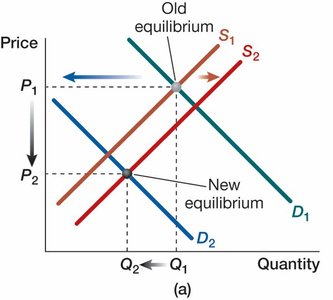
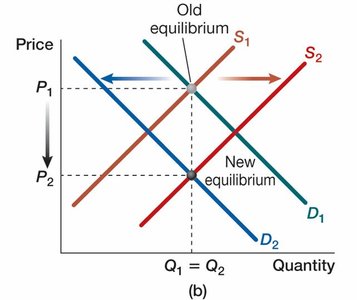
When both curves shift, the effect on equilibrium price and quantity depends on the magnitude and direction of each shift.
Case | Equilibrium Price | Equilibrium Quantity |
|---|---|---|
Demand shifts left, Supply shifts right | Decreases | Ambiguous |
Demand shifts right, Supply shifts left | Increases | Ambiguous |
Both shift right | Ambiguous | Increases |
Both shift left | Ambiguous | Decreases |
Applications and Examples
Government Price Controls: Price Ceilings
A price ceiling is a government-imposed limit on how high a price can be charged. If set below equilibrium, it causes excess demand (shortage).
Example: During the 1973–1974 U.S. oil crisis, the government capped gasoline prices, resulting in long lines and shortages.
Real-World Example: Roses on Valentine’s Day
Demand for roses increases sharply before Valentine’s Day, shifting the demand curve right and raising the equilibrium price. If supply cannot adjust quickly (due to perishability), prices rise significantly.
Real-World Example: Beer before Super Bowl Sunday
Both demand and supply for beer increase before the Super Bowl. Because beer can be stored, producers ramp up supply in anticipation, preventing large price increases.
Summary Table: Effects of Simultaneous Shifts
Shift | Equilibrium Price | Equilibrium Quantity |
|---|---|---|
Demand ↑, Supply ↑ | Ambiguous | Increases |
Demand ↓, Supply ↓ | Ambiguous | Decreases |
Demand ↑, Supply ↓ | Increases | Ambiguous |
Demand ↓, Supply ↑ | Decreases | Ambiguous |
Key Terms and Concepts
Demand Curve: Graphical representation of the relationship between price and quantity demanded.
Supply Curve: Graphical representation of the relationship between price and quantity supplied.
Equilibrium: The point where quantity demanded equals quantity supplied.
Excess Demand (Shortage): Quantity demanded exceeds quantity supplied at a given price.
Excess Supply (Surplus): Quantity supplied exceeds quantity demanded at a given price.
Price Ceiling: A legal maximum on the price at which a good can be sold.
Ceteris Paribus: The assumption that all other variables are held constant except the one under study.
Formulas and Equations
General Demand Function:
General Supply Function:
Equilibrium Condition:
