 Indietro
Microeconomics Exam 1 Review – Step-by-Step Guidance
Guida di studio - Note intelligenti
 Appunti personalizzati basati sui tuoi materiali, ampliati con definizioni chiave, esempi e contesto.
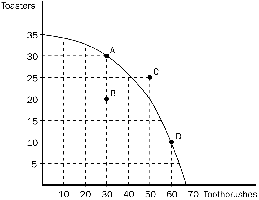
Q6. On the production possibilities frontier shown, the opportunity cost to the economy of getting 30 additional toothbrushes by moving from point A to point D is
Background
Topic: Production Possibilities Frontier (PPF) and Opportunity Cost
This question tests your understanding of how to use the PPF to calculate opportunity cost, which is the value of the next best alternative foregone when making a choice.
Key Terms and Formulas
Production Possibilities Frontier (PPF): A curve showing the maximum attainable combinations of two products that may be produced with available resources and technology.
Opportunity Cost: The amount of one good that must be given up to produce more of another good.
Formula:
Step-by-Step Guidance
Identify the coordinates for points A and D on the PPF. Point A and D represent different combinations of toasters and toothbrushes.
Calculate the change in the number of toothbrushes (Good X) and the change in the number of toasters (Good Y) as you move from point A to point D.
Find the difference in the number of toasters (how many fewer toasters are produced) and the difference in the number of toothbrushes (how many more toothbrushes are produced).
Set up the opportunity cost formula:
Try solving on your own before revealing the answer!
Final Answer: 20 toasters
Moving from point A to point D, the economy gains 30 toothbrushes but gives up 20 toasters. Thus, the opportunity cost of 30 additional toothbrushes is 20 toasters.
Q7. On the production possibilities frontier shown, the opportunity cost of getting 15 additional toasters by moving from point D to point C is
Background
Topic: Opportunity Cost on the PPF
This question asks you to calculate the opportunity cost of increasing the production of one good (toasters) by reducing the production of another (toothbrushes) along the PPF.
Key Terms and Formulas
Opportunity Cost: The value of the next best alternative forgone.
Formula:
Step-by-Step Guidance
Locate points D and C on the PPF and note the quantities of toasters and toothbrushes at each point.
Calculate the increase in toasters (Good Y) and the decrease in toothbrushes (Good X) as you move from D to C.
Set up the opportunity cost formula:
Plug in the values for the change in toothbrushes and toasters, but do not compute the final value yet.
Try solving on your own before revealing the answer!
Final Answer: 30 toothbrushes
Moving from point D to point C, the economy gains 15 toasters but gives up 30 toothbrushes. Thus, the opportunity cost of 15 additional toasters is 30 toothbrushes.
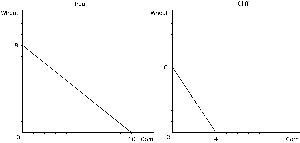
Q10. According to the graph, the opportunity cost of 1 bushel of wheat for Cliff is
Background
Topic: Comparative Advantage and Opportunity Cost
This question tests your ability to read a PPF and calculate the opportunity cost of producing one good in terms of another for a specific producer.
Key Terms and Formulas
Opportunity Cost: The amount of one good that must be given up to produce an additional unit of another good.
Formula:
Step-by-Step Guidance
Look at Cliff's PPF and identify the maximum amount of wheat and corn he can produce if he specializes in each.
Calculate how much corn Cliff gives up to produce one more bushel of wheat.
Set up the opportunity cost formula using Cliff's maximum outputs.
Express the opportunity cost as a ratio (bushels of corn per bushel of wheat).
Try solving on your own before revealing the answer!
Final Answer: 2/3 bushel of corn
Cliff's opportunity cost of producing 1 bushel of wheat is 2/3 of a bushel of corn, based on his PPF endpoints.
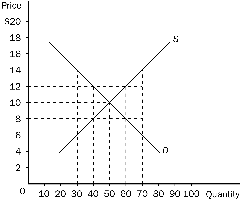
Q21. According to the graph shown, in this market, equilibrium price and quantity would be
Background
Topic: Market Equilibrium
This question tests your ability to find the equilibrium price and quantity where the supply and demand curves intersect on a graph.
Key Terms and Formulas
Equilibrium Price: The price at which quantity demanded equals quantity supplied.
Equilibrium Quantity: The quantity bought and sold at the equilibrium price.
Step-by-Step Guidance
Locate the point where the supply (S) and demand (D) curves intersect on the graph.
Read the price at this intersection point from the vertical axis (Price).
Read the quantity at this intersection point from the horizontal axis (Quantity).
Match these values to the answer choices provided.
Try solving on your own before revealing the answer!
Final Answer: $10, 50
The equilibrium occurs where the supply and demand curves cross, which is at a price of $10 and a quantity of 50 units.
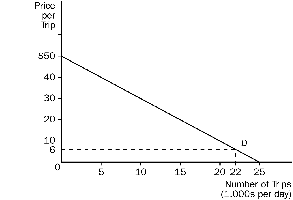
Q30. This diagram shows the demand for trips across a bridge that spans the Hudson River. If the price of crossing the bridge is $6.00, consumer surplus is
Background
Topic: Consumer Surplus
This question tests your understanding of how to calculate consumer surplus using a demand curve and a given price.
Key Terms and Formulas
Consumer Surplus: The difference between what consumers are willing to pay for a good and what they actually pay.
Formula (for a linear demand curve):
Base: Number of trips (quantity at the market price)
Height: Difference between the highest price consumers are willing to pay and the market price
Step-by-Step Guidance
Find the quantity of trips demanded at the price of $6.00 by locating the intersection of the price line and the demand curve.
Determine the maximum price consumers are willing to pay for the first trip (the vertical intercept of the demand curve).
Calculate the "height" of the consumer surplus triangle (maximum willingness to pay minus market price).
Calculate the "base" of the triangle (number of trips at $6.00).
Set up the consumer surplus formula, but do not compute the final value yet.
Try solving on your own before revealing the answer!
Final Answer: $484
Consumer surplus is the area of the triangle above the price line and below the demand curve, which calculates to $484 at a price of $6.00.
