 Indietro
Microeconomics Exam I Review: Foundations, Models, and Market Analysis
Guida di studio - Note intelligenti
 Appunti personalizzati basati sui tuoi materiali, ampliati con definizioni chiave, esempi e contesto.
Scarcity, Models, and Market Fundamentals
Scarcity and Economic Models
Scarcity is a fundamental concept in economics, describing a situation where unlimited wants exceed the limited resources available to fulfill those wants. Economists use models, which are simplified representations of reality, to analyze and predict economic behavior.
Scarcity: Unlimited wants vs. limited resources.
Model: Simplified representation of economic reality.
Market: Institution where buyers and sellers trade goods or services.
Assumptions in Market Analysis
When analyzing markets, economists make several key assumptions:
People are rational: Individuals make decisions to maximize their benefit.
People respond to economic incentives: Changes in costs or benefits influence behavior.
Optimal decisions are made at the margin: Marginal analysis involves comparing additional benefits and costs.
Trade-offs and Opportunity Cost
Due to scarcity, producing more of one good means producing less of another. The opportunity cost is the highest-valued alternative forgone when making a decision.
Trade-off: Choosing between alternatives due to limited resources.
Opportunity cost: Value of the next best alternative given up.
Types of Economies
Centrally planned economy: Government allocates resources.
Market economy: Households and firms allocate resources through markets.
Efficiency and Economic Statements
Productive efficiency: Goods produced at lowest cost.
Allocative efficiency: Production matches consumer preferences.
Positive statement: Testable 'what is' statement.
Normative statement: Non-testable 'what should be' statement.
Microeconomics vs. Macroeconomics
Microeconomics: Study of individual choices, market interactions, and government influence.
Macroeconomics: Study of the economy as a whole (inflation, unemployment, growth).
Key Terms
Technology: Process used to produce goods/services.
Capital: Manufactured goods used for production.
Voluntary exchange: Both buyer and seller benefit from trade.
Production Possibilities and Comparative Advantage
Production Possibilities Frontier (PPF)
The PPF illustrates the maximum attainable combinations of two goods that can be produced with available resources and technology.
Opportunity cost: Highest-valued alternative forgone.
Increasing marginal opportunity costs: Causes the PPF to be bowed out.
Economic growth: Outward shift of the PPF due to new technology, labor, or capital.
Absolute and Comparative Advantage
Absolute advantage: Ability to produce more with same resources.
Comparative advantage: Ability to produce at lower opportunity cost.
Specialization: Results from comparative advantage.
Basis for trade: Comparative, not absolute, advantage.
Market Structure and Circular Flow
Market: Buyers and sellers trade goods/services.
Households: Provide factors of production (labor, capital, natural resources).
Firms: Supply goods/services to product markets.
Circular-flow diagram: Model linking market participants.
Factors of Production
Labor
Capital
Natural Resources
Entrepreneurs: Operate businesses, combine factors to produce goods/services.
Market System and Legal Foundations
Free market: Few government restrictions.
Property rights: Legal protection and enforcement are essential for market success.
Demand, Supply, and Market Equilibrium
Perfect Competition and Demand
A perfectly competitive market has many buyers and sellers, identical products, and no barriers to entry.
Market demand: Total demand by all consumers.
Demand schedule: Table showing price-quantity relationship.
Demand curve: Graphical representation of price-quantity relationship.
Quantity demanded: Amount consumers are willing and able to buy at a given price.
Ceteris paribus: Holding other variables constant when analyzing two variables.
Law of Demand
Law of demand: Price falls → quantity demanded rises; price rises → quantity demanded falls.
Substitution effect: Price change makes a good more/less expensive relative to others.
Income effect: Price change affects consumer purchasing power.
Shifts in Demand
Increase/decrease in demand: Caused by factors other than price.
Normal goods: Demand increases as income rises.
Inferior goods: Demand increases as income falls.
Substitutes: Goods used for same purpose; price increase in one raises demand for the other.
Complements: Goods used together; price increase in one lowers demand for the other.
Supply and Law of Supply
Supply schedule: Table showing price-quantity supplied relationship.
Supply curve: Graphical representation of price-quantity supplied relationship.
Quantity supplied: Amount firms are willing and able to supply at a given price.
Law of supply: Price rises → quantity supplied rises; price falls → quantity supplied falls.
Shifts in Supply
Inputs: Used in production; price increase decreases supply.
Technological change: Positive/negative changes shift supply.
Substitutes/complements in production: Price changes affect supply.
Number of firms: More firms increase supply.
Expected future prices: Anticipation of higher prices may decrease current supply.
Market Equilibrium
Equilibrium: Quantity demanded equals quantity supplied.
Shortage: Quantity demanded > quantity supplied.
Surplus: Quantity supplied > quantity demanded.
Equilibrium price: Price at which equilibrium occurs.
Equilibrium quantity: Quantity at equilibrium price.
Effects of Shifts in Demand and Supply
Demand and supply shifts affect equilibrium price and quantity in various ways.
Simultaneous shifts can increase, decrease, or leave unchanged price and quantity depending on the magnitude of each shift.
Consumer Surplus, Producer Surplus, and Economic Efficiency
Consumer and Producer Surplus
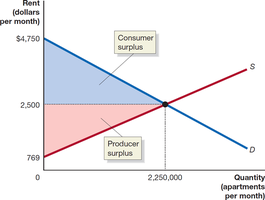
Consumer surplus is the difference between the highest price a consumer is willing to pay and the actual price paid. Producer surplus is the difference between the lowest price a firm would accept and the price it actually receives.
Consumer surplus: Area below demand curve and above price.
Producer surplus: Area above supply curve and below price.
Marginal cost: Additional cost of producing one more unit.
Marginal benefit: Additional benefit from consuming one more unit.
Example: The graph below illustrates consumer and producer surplus at market equilibrium for apartments in New York City.
Economic Efficiency and Deadweight Loss
Economic efficiency: Market is efficient if all trades occur where marginal benefit exceeds marginal cost, and no other trades take place.
Economic surplus: Sum of consumer and producer surplus.
Deadweight loss: Reduction in economic surplus from market not being in equilibrium.
Example: Imposing a rent ceiling creates deadweight loss, as shown in the graph below.
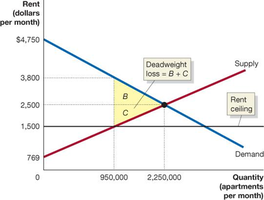
Price ceiling: Legally determined maximum price.
Price floor: Legally determined minimum price.
Black market: Transactions at prices violating regulations.
Tax Incidence and Efficiency
Excess burden: Deadweight loss from a tax.
Tax incidence: Actual division of tax burden between buyers and sellers.
Incidence determined by: Relative slopes of demand and supply curves.
Steep demand curve: Buyers bear more tax burden.
Shallow demand curve: Sellers bear more tax burden.
Externalities, Public Goods, and Market Failure
Externalities and the Coase Theorem
Externalities are benefits or costs affecting those not directly involved in production or consumption. The Coase theorem states that if transaction costs are low, private bargaining can solve externality problems efficiently, regardless of property rights assignment.
Command-and-control: Government imposes limits or requires pollution control devices.
Market-based policies: Use incentives (e.g., carbon taxes) to control pollution.
Types of Goods and Market Failure
Private good: Rival and excludable (e.g., Big Mac).
Public good: Nonrival and nonexcludable (e.g., court system).
Quasi-public good: Nonrival and excludable (e.g., cable TV).
Common resource: Rival and nonexcludable (e.g., fish in the ocean).
Key Concepts
Excludability: Non-payers cannot consume the good.
Rivalry: One person's consumption prevents others from consuming.
Free riding: Benefiting without paying.
Market failure: Market does not produce efficient output.
Pigovian taxes/subsidies: Used to correct externalities.
Property rights: Exclusive use, including buying/selling.
Tragedy of the commons: Overuse of common resources.
Transaction costs: Costs incurred in exchange agreements.
Social vs. Private Costs and Benefits
Private benefit: Benefit to consumer.
Private cost: Cost to producer.
Social benefit: Total benefit (private + external).
Social cost: Total cost (private + external).
Negative and Positive Externalities
Negative externality: Social cost > private cost; too much produced.
Positive externality: Social benefit > private benefit; too little produced.
Additional info: These notes cover foundational concepts from Chapters 1-5 of a typical college microeconomics course, including models, market analysis, efficiency, and externalities. All equations and calculations referenced (e.g., consumer surplus, deadweight loss) are based on standard microeconomic formulas.
