 Indietro
Microeconomics Foundations: Math Review and Economic Models
Guida di studio - Note intelligenti
 Appunti personalizzati basati sui tuoi materiali, ampliati con definizioni chiave, esempi e contesto.
Chapter 1: Economic Foundations and Models
Definition of Economics
Economics is the study of how individuals, firms, and governments make choices to allocate scarce resources to satisfy their unlimited wants. The field analyzes the decision-making processes and the resulting outcomes in markets and society.
Scarcity: The fundamental economic problem of having limited resources to meet unlimited wants.
Choice: Because resources are scarce, economic agents must make choices about what to consume, produce, and allocate.
Economic Agents
Economic agents are the decision-makers in an economy. They include:
Consumers: Individuals or households that purchase goods and services to satisfy their needs and wants.
Firms: Organizations that produce goods and services using inputs (labor, capital, etc.) to maximize profit.
Government: The public sector, which sets policies, collects taxes, and provides public goods and services.
Example: If you have a $10 budget for dinner, you must choose between options such as pizza ($7) or salad ($10). This illustrates the concept of opportunity cost—the value of the next best alternative forgone.
Goals and Individual Behavior
Economic agents act according to certain goals and behavioral hypotheses:
Consumers: Aim to maximize utility (satisfaction) given their budget constraints.
Firms: Seek to maximize profit by efficiently combining inputs to produce outputs.
Government: Strives to maximize social welfare, often balancing efficiency and equity.
Example: AI companies must decide how to allocate resources between research, development, and marketing to maximize their market share and profits.
Three Hypotheses on Individual Behavior
Hypothesis I: Rationality – Economic agents are assumed to make decisions that best achieve their objectives, given available information and constraints.
Hypothesis II: People Respond to Incentives – Changes in costs or benefits influence the choices of individuals and firms.
Hypothesis III: Optimal Decisions Are Made at the Margin – Decisions are made by comparing marginal benefits and marginal costs. An action is taken if the marginal benefit exceeds the marginal cost.
Choices and Economic Constraints
All economic agents face constraints that limit their choices:
Consumers: Limited by income and prices of goods and services.
Firms: Limited by technology, input costs, and market competition.
Government: Limited by tax revenues, political considerations, and legal frameworks.
Appendix: Math Review for Economics
Percentages
Calculating Percentage Rate: To find the percentage rate, divide the part by the whole and multiply by 100.
Example: If the sales tax on a (1.80/60) \times 100 = 3\% $.
Multiple Percentages: To find the percentage of a subset, multiply the fractions. For example, if 2/3 of guests ordered salad and 1/4 of those also ordered soup, then of all guests ordered both. As a percentage: .
Discounts: A 40% discount on a 500 \times (1 - 0.40) = 500 \times 0.60 = 300 $.
Basic Algebra and Equations
Solving Linear Equations: Rearranging equations to solve for unknowns.
Example: If a number divided by 7, then by 3, equals 2: Let be the number. .
Factoring: To factor by , factor out $q$: .
Lines and Graphs
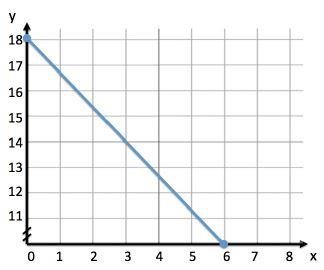
Understanding linear equations is essential for economic modeling. The general form is , where is the slope and is the y-intercept.
Finding the y-intercept (): The value of when .
Finding the slope (): The change in for a one-unit change in .
Solving for given : Rearrange the equation to solve for .
Areas of Geometric Shapes
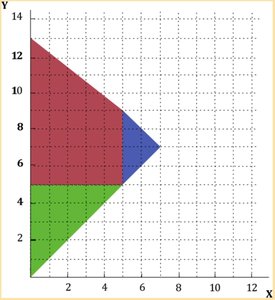
Calculating areas is useful for understanding economic models involving space, such as production possibility frontiers.
Area of a Triangle:
Area of a Rectangle:
Composite Areas: For irregular shapes, divide into known shapes and sum their areas.
Everyday Economics: Application Example
Consider the decision of what to eat for dinner with a $10 budget. If pizza costs $7 and salad costs $10, choosing one means forgoing the other. This illustrates opportunity cost—the value of the next best alternative not chosen.
Summary Table: Economic Agents and Their Constraints
Agent | Goal | Constraint |
|---|---|---|
Consumer | Maximize utility | Income, prices |
Firm | Maximize profit | Technology, input costs |
Government | Maximize social welfare | Budget, policy limits |
Additional info: The math review is foundational for understanding graphs, formulas, and quantitative analysis in microeconomics. The behavioral hypotheses are central to economic modeling and analysis in all subsequent chapters.
