 Indietro
Microeconomics Midterm Study Guide: Key Concepts and Applications
Guida di studio - Note intelligenti
 Appunti personalizzati basati sui tuoi materiali, ampliati con definizioni chiave, esempi e contesto.
Economics: Foundations and Models
Definitions and Core Questions
Economics is the study of how societies allocate scarce resources to satisfy unlimited wants. Microeconomics focuses on individual markets and agents, while macroeconomics examines the economy as a whole. Every economy must answer three fundamental questions:
What to produce? Deciding which goods and services to make.
How to produce? Choosing production methods and resource allocation.
Who gets what is produced? Determining distribution among individuals and groups.
Trade-offs, Comparative Advantage, and the Market System
Opportunity Cost and Production Possibility Frontier (PPF)
Opportunity Cost: The value of the next best alternative foregone when making a choice.
Identifying and Calculating Opportunity Cost: Compare alternatives and quantify what is sacrificed.
Production Possibility Frontier (PPF): A curve showing the maximum attainable combinations of two products that may be produced with available resources and technology.
Efficiency: Points on the PPF represent efficient production; points inside are inefficient, and points outside are unattainable.
Economic Growth: Outward shift of the PPF due to increased resources or improved technology.
Scarcity, Trade-offs, and Comparative Advantage
Scarcity: Limited resources force choices and trade-offs.
Comparative Advantage: The ability to produce a good at a lower opportunity cost than others.
Circular Flow Model and Market Systems
Circular Flow Model: Illustrates the flow of goods, services, and money between households and firms through product and factor markets.
Product Market: Where goods and services are bought and sold.
Factor Market: Where resources (labor, capital, land) are bought and sold.
Role of Government: Regulates markets, provides public goods, and enforces property rights.
Role of Entrepreneurs: Organize production and drive innovation.
Role of Property Rights: Secure ownership encourages investment and trade.
Where Prices Come From: The Interaction of Demand and Supply
Demand and Supply Concepts
Demand: The quantity of a good consumers are willing and able to buy at various prices.
Law of Demand: As price decreases, quantity demanded increases (inverse relationship).
Demand Curve: Graphical representation of the relationship between price and quantity demanded.
Change in Demand: Shift of the demand curve due to factors other than price.
Causes of Change in Demand
Price of Related Goods: Substitutes (increase in price of one increases demand for the other), Complements (increase in price of one decreases demand for the other).
Income: Normal goods (demand increases with income), Inferior goods (demand decreases with income).
Expectations: Anticipated changes in future prices or income.
Number of Buyers: More buyers increase demand.
Tastes and Preferences: Changes in consumer preferences affect demand.
Supply: The quantity of a good producers are willing and able to sell at various prices.
Law of Supply: As price increases, quantity supplied increases (direct relationship).
Supply Curve: Graphical representation of the relationship between price and quantity supplied.
Change in Supply: Shift of the supply curve due to factors other than price.
Causes of Change in Supply
Price of Related Goods
Price of Resources and Inputs
Expectations of Future Prices and Costs
Number of Sellers
Productivity
Market Equilibrium, Shortage, and Surplus
Market Equilibrium: The point where demand and supply curves intersect, determining equilibrium price and quantity.
Equilibrium Price: The price at which quantity demanded equals quantity supplied.
Equilibrium Quantity: The quantity bought and sold at equilibrium price.
Shortage: Quantity demanded exceeds quantity supplied at a given price.
Surplus: Quantity supplied exceeds quantity demanded at a given price.
Elasticity: The Responsiveness of Demand and Supply
Price Elasticity of Demand
Definition: Measures how much quantity demanded changes in response to a change in price.
Formula:
Calculating Percentage Changes:
Elastic, Unit Elastic, and Inelastic:
Elastic (): Quantity demanded changes more than price.
Unit Elastic (): Quantity demanded changes exactly as price.
Inelastic (): Quantity demanded changes less than price.
Total Revenue: Maximized where on the demand curve.
Determinants: Availability of substitutes, proportion of income spent, time period, luxury vs necessity.
Cross Elasticity and Income Elasticity
Cross Elasticity: Measures responsiveness of demand for one good to changes in price of another. Negative: Complements; Positive: Substitutes.
Income Elasticity: Measures responsiveness of demand to changes in income. Negative: Inferior goods; Between 0 and 1: Normal goods; Greater than 1: Luxury goods.
Consumer Choice and Behavioral Economics
Utility Concepts
Marginal Utility: The additional satisfaction from consuming one more unit of a good.
Total Utility: The total satisfaction from all units consumed.
Law of Diminishing Marginal Utility: As more units are consumed, marginal utility decreases.
Marginal Utility per Dollar:
Decision Rules:
For goods with same price: Choose based on marginal utility.
For goods with different prices: Choose based on marginal utility per dollar, tracking remaining budget.
Technology, Production, and Costs
Marginal Product and Cost Calculations
Marginal Product: The additional output from one more unit of input.
Total Cost (TC): Sum of all costs incurred in production.
Average Total Cost (ATC):
Average Variable Cost (AVC):
Marginal Cost (MC):
Cost Curves and Relationships
ATC, AVC, and MC curves:
ATC and AVC are typically U-shaped due to economies and diseconomies of scale.
MC intersects ATC and AVC at their minimum points.
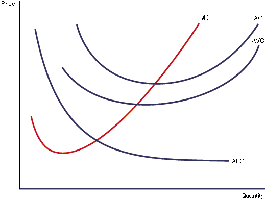
Cost Table Example
Output (Q) | Total Cost (TC) | Average Total Cost (ATC) | Average Variable Cost (AVC) | Marginal Cost (MC) |
|---|---|---|---|---|
1 | 100 | 100 | 80 | 80 |
2 | 180 | 90 | 70 | 60 |
3 | 240 | 80 | 60 | 40 |
4 | 280 | 70 | 50 | 20 |
5 | 320 | 64 | 48 | 40 |
6 | 380 | 63.3 | 50 | 60 |
7 | 460 | 65.7 | 54 | 80 |
Additional info: Table values are illustrative; actual values depend on specific cost functions. ----------------------------------------
