 Indietro
Microeconomics Study Guide: Core Concepts, Formulas, and Graphs
Guida di studio - Note intelligenti
 Appunti personalizzati basati sui tuoi materiali, ampliati con definizioni chiave, esempi e contesto.
Master Formula Sheet
Key Microeconomics Formulas
This section summarizes the essential formulas used throughout microeconomics, providing definitions, context, and applications for each.
Real Price Adjustment: Converts nominal prices to real prices using the Consumer Price Index (CPI) to account for inflation.

Percent Change: Used for calculating elasticity and growth rates.

Market Equilibrium: Equilibrium occurs where quantity demanded equals quantity supplied.

Point Price Elasticity of Demand: Measures responsiveness at a specific point on the demand curve.

Arc Elasticity: Used for large changes between two points.

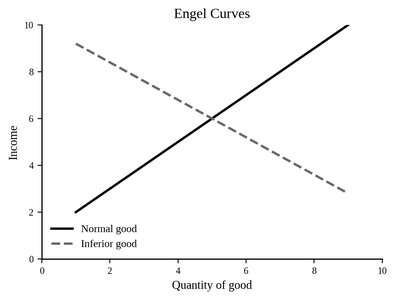
Income and Cross-Price Elasticity: Classifies goods as normal/inferior and substitutes/complements.

Budget Line: Shows all affordable bundles for a consumer.

Consumer Optimum: At the interior optimum, the marginal rate of substitution equals the price ratio.

Market Demand: The sum of individual demands at each price.

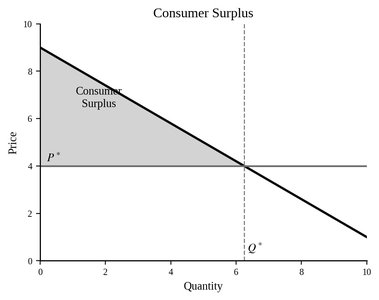
Consumer Surplus: Area under the demand curve and above the price paid.

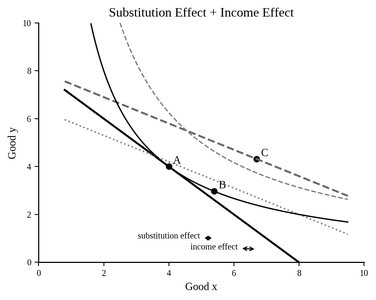
Slutsky Equation: Decomposes the total price effect into substitution and income effects.

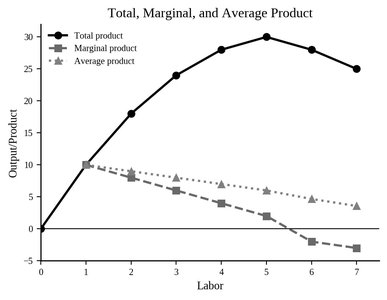
Marginal and Average Product: Marginal product is extra output from one more unit; average product is output per worker.

Marginal Rate of Technical Substitution (MRTS): Technical tradeoff between labor and capital.

Returns to Scale: Classifies output response to scaling all inputs.

Cobb-Douglas Returns: For Cobb-Douglas, add exponents to classify returns to scale.

Cost-Minimization Connection: Choose input mix where MRTS equals input price ratio.

Chapter 2 - Supply and Demand
Market Model and Equilibrium
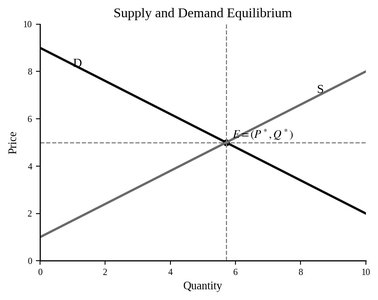
Supply and demand are the foundation of market analysis. The equilibrium price and quantity are determined where the supply and demand curves intersect.
Demand Curve: Shows the relationship between price and quantity demanded, typically downward sloping.
Supply Curve: Shows the relationship between price and quantity supplied, typically upward sloping.
Equilibrium: The intersection of supply and demand curves determines the market price and quantity.
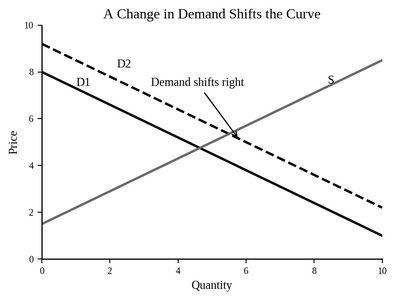
Curve Shifts: Changes in demand or supply shift the respective curve, altering equilibrium.
Price Controls
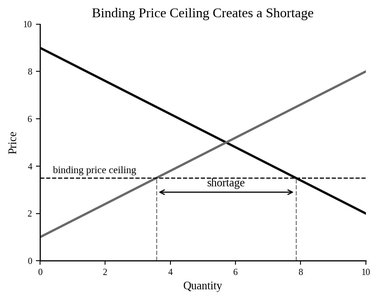
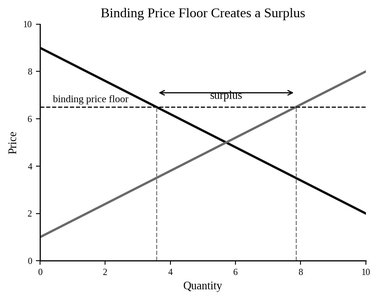
Government interventions such as price ceilings and floors affect market outcomes.
Price Ceiling: A legal maximum price, binding if below equilibrium, creates a shortage.
Price Floor: A legal minimum price, binding if above equilibrium, creates a surplus.
Elasticity
Elasticity measures how responsive quantity demanded or supplied is to changes in price, income, or other factors.
Point Elasticity:

Arc Elasticity:

Total Revenue and Elasticity:

Chapter 3 - Consumer Behavior
Utility Maximization and Budget Constraints
Consumers choose the best affordable bundle by maximizing utility subject to their budget constraint.
Utility Maximization: Occurs where the highest indifference curve is tangent to the budget line.
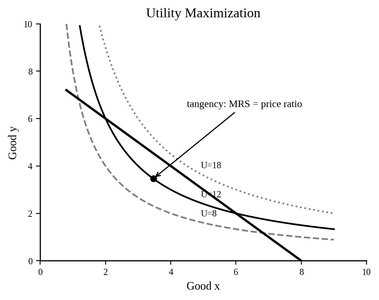
Budget Line: Shows all affordable combinations of goods.

Consumer Optimum:

Indifference Curves
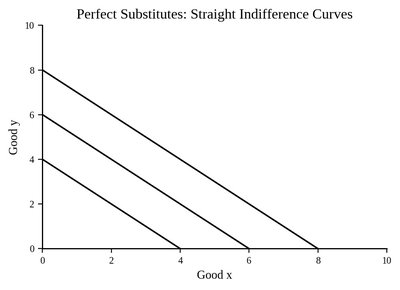
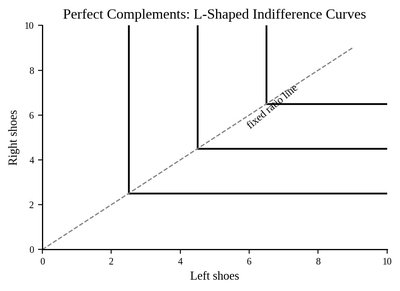
Indifference curves represent combinations of goods that yield the same utility.
Perfect Substitutes: Straight-line indifference curves.
Perfect Complements: L-shaped indifference curves.
Chapter 4 - Individual and Market Demand
Price-Consumption and Engel Curves
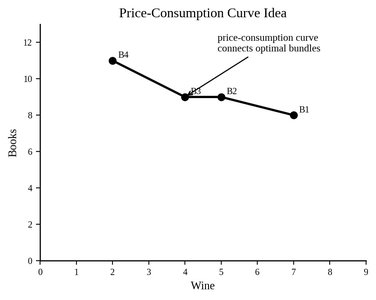
These curves illustrate how consumer choices change with price and income.
Price-Consumption Curve: Connects optimal bundles as price changes.
Engel Curve: Shows relationship between income and quantity demanded.
Income and Substitution Effects
When price changes, the total effect is split into substitution and income effects.
Slutsky Equation:

Graphical Decomposition:
Consumer Surplus
Consumer surplus is the extra benefit consumers receive from paying less than their maximum willingness to pay.
Consumer Surplus Formula:

Triangle Area Shortcut:

Consumer Surplus Graph:
Chapter 6 - Production
Production Function and Input Relationships
Firms use inputs to produce output, and the production function shows the maximum output possible from given inputs.
Marginal and Average Product:

Graph of Total, Marginal, and Average Product:
Isoquants and MRTS
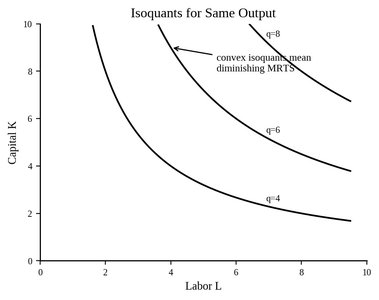
Isoquants show combinations of inputs that yield the same output. MRTS measures the rate at which one input can be substituted for another.
Isoquants:
MRTS Formula:

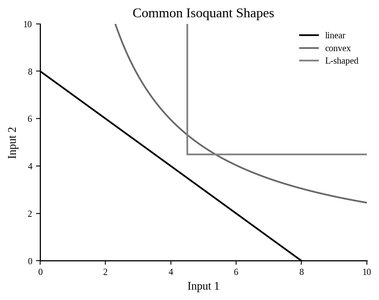
Isoquant Shapes:
Returns to Scale
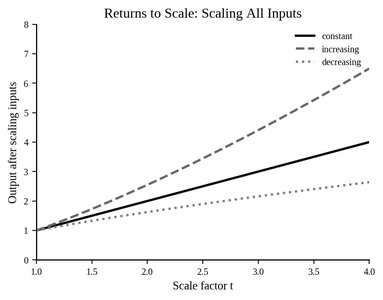
Returns to scale describe how output changes when all inputs are increased proportionally.
Returns to Scale Formula:

Returns to Scale Graph:
Cobb-Douglas Production Function:

Marginal Products in Cobb-Douglas:

Graph Interpretation Cheat Sheet
How to Read Microeconomic Graphs
Step 1: Identify axes (e.g., price, quantity, income, input).
Step 2: Identify what changed (e.g., price, income, technology).
Step 3: Decide if the change is a movement along a curve or a shift/rotation.
Step 4: Compare old and new points; state what happened to price, quantity, utility, output, or input use.
Common Graph Types: Supply and demand, budget line, indifference curve, Engel curve, demand curve, isoquant, total product curve, MP/AP curves.
Common Exam Traps: Confusing movement along a curve with a shift, misunderstanding diminishing returns, misinterpreting price controls, and misclassifying goods by elasticity signs.
