 Indietro
Microeconomics Study Guide: Costs, Supply, Surplus, and Externalities
Guida di studio - Note intelligenti
 Appunti personalizzati basati sui tuoi materiali, ampliati con definizioni chiave, esempi e contesto.
Firms and Production
Production Functions and Inputs
In microeconomics, firms transform inputs into outputs using technology. The production function describes this relationship mathematically.
Production Function: , where q is output, L is labor, and K is capital.
Isoquant Curve: A set of input bundles that produce the same output.
Isoquant Map: Collection of isoquant curves for different output levels.
Short Run: Some inputs (e.g., labor) are adjustable, others (e.g., capital) are fixed.
Long Run: All inputs are adjustable.
Example: A factory may adjust labor daily but can only change machinery over years.
Costs
Short-Run Cost Functions
Short-run costs are divided into fixed and variable components. The cost functions help firms decide how much to produce.
Fixed Cost (FC): Costs that do not change with output (e.g., rent).
Variable Cost (VC): Costs that change with output (e.g., wages).
Total Cost (TC):
Marginal Cost (MC):
Average Cost (AC):
Average Variable Cost (AVC):
Average Fixed Cost (AFC):
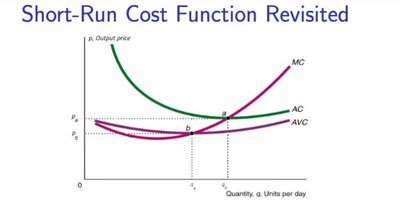
Typical Properties: AC and AVC are U-shaped. MC intersects AC and AVC at their minimum points.
Long-Run Cost Functions
In the long run, all inputs are variable. The long-run average cost (LRAC) and long-run marginal cost (LRMC) are key concepts.
Long-Run Cost Function:
Long-Run Average Cost:
Long-Run Marginal Cost:
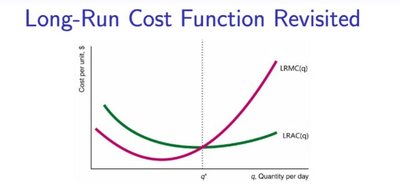
LRAC is U-shaped: Decreases due to economies of scale, then increases due to diseconomies.
Relationship:
When :
When :
When :
Supply Curves
Short-Run Individual Supply Curve
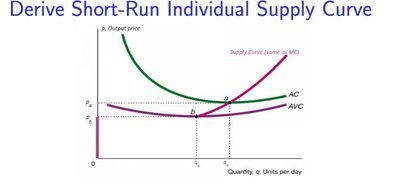
The short-run supply curve is the portion of the MC curve above AVC. Producers supply output where price is greater than or equal to AVC.
Shut-down Price (): If , supply is zero.
Break-even Price (): If , producer earns zero profit.
Supply Decision: If , produce where .
Long-Run Individual Supply Curve
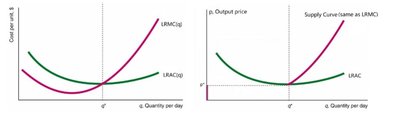
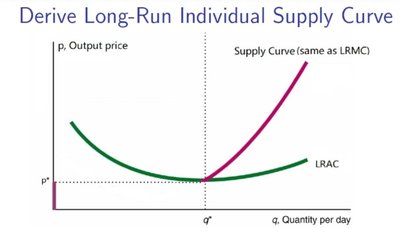
The long-run supply curve is the portion of the LRMC curve above LRAC. In the long run, producers can enter or exit freely.
Long-Run Shut-down Price (): If , supply is zero.
Break-even Price: is both shut-down and break-even price in the long run.
Supply Decision: If , produce where .
Market Supply Curve
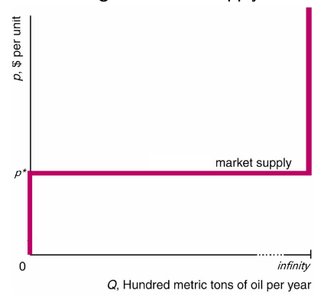
The market supply curve aggregates individual supply curves. In the long run, the supply curve is horizontal at the break-even price if there are infinitely many identical producers.
Short Run: Sum individual supply curves for given producers.
Long Run: Entry and exit lead to a horizontal supply curve at .
Economic Surplus
Producer Surplus (PS)
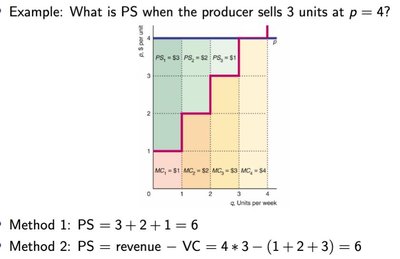
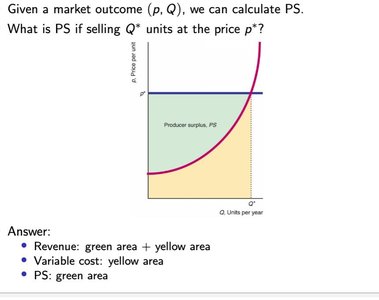
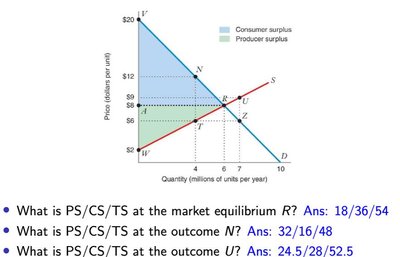
Producer surplus is the gain from trade for producers, calculated as revenue minus variable cost.
PS Calculation: Two methods:
Sum marginal gains unit by unit.
PS = Revenue - VC
Consumer Surplus (CS)
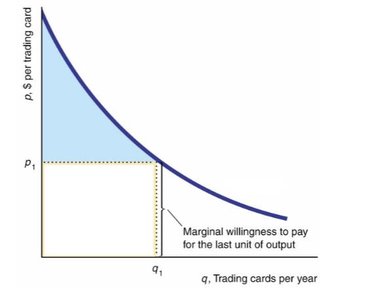
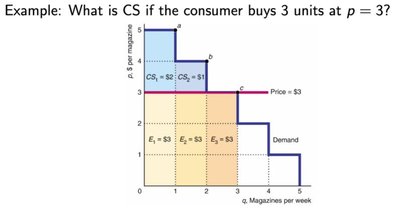
Consumer surplus is the gain from trade for consumers, calculated as willingness to pay minus expenditure.
Marginal Willingness to Pay (MWTP): The demand curve represents MWTP.
CS Calculation: Two methods:
Sum marginal gains unit by unit.
CS = WTP - Expenditure
Total Surplus (TS)
Total surplus is the sum of producer and consumer surplus, representing social welfare.
TS Formula:
Market Equilibrium: Maximizes total surplus when MWTP = MC.
Market Interventions
Tax
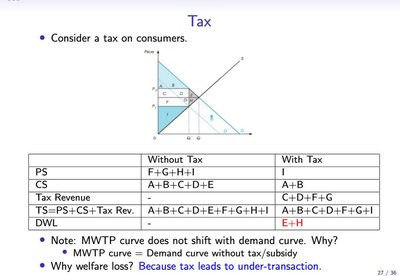
A tax reduces the quantity traded, leading to deadweight loss and lower total surplus.
Tax Revenue: Collected by government.
Deadweight Loss (DWL): Lost surplus due to under-transaction.
Without Tax | With Tax | |
|---|---|---|
PS | F+G+H+I | I |
CS | A+B+C+D+E | A+B |
Tax Revenue | - | C+D+F+G |
TS | PS+CS+Tax Rev | PS+CS+Tax Rev |
DWL | - | E+H |
Subsidy
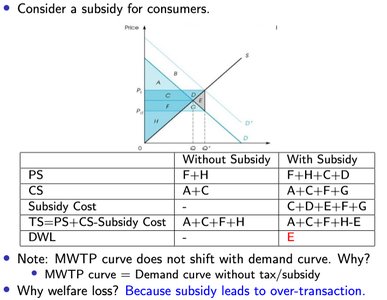
A subsidy increases the quantity traded, leading to deadweight loss from over-transaction.
Subsidy Cost: Paid by government.
Deadweight Loss (DWL): Lost surplus due to over-transaction.
Without Subsidy | With Subsidy | |
|---|---|---|
PS | F+H | F+H+C+D |
CS | A+C | A+C+F+G |
Subsidy Cost | - | C+D+F+G |
TS | PS+CS-Subsidy Cost | PS+CS-Subsidy Cost |
DWL | - | E |
Price Controls
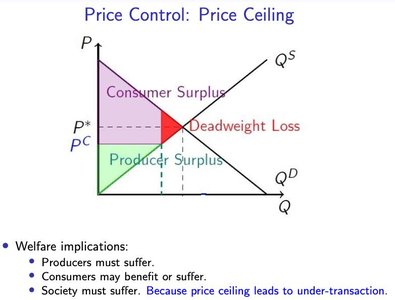
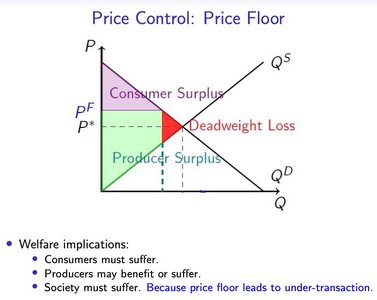
Price ceilings and floors cause deadweight loss by restricting market transactions.
Price Ceiling: Maximum price allowed; leads to under-transaction.
Price Floor: Minimum price allowed; also leads to under-transaction.
Import Ban and Tariff
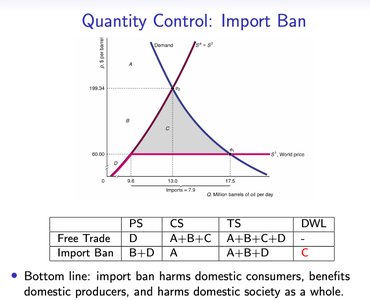
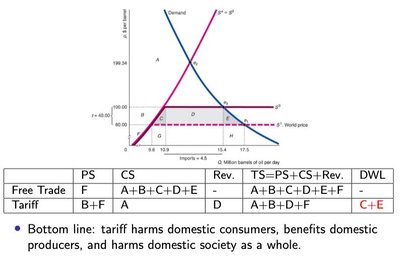
Import bans and tariffs restrict trade, harming consumers and society overall, but benefiting domestic producers.
Free Trade | Import Ban | |
|---|---|---|
PS | D | B+D |
CS | A+B+C | A |
TS | A+B+C+D | A+B+D |
DWL | - | C |
Free Trade | Tariff | |
|---|---|---|
PS | F | B+F |
CS | A+B+C+D+E | A |
Rev. | - | D |
TS | A+B+C+D+E+F | A+B+D+F |
DWL | - | C+E |
Externalities
Negative Externalities
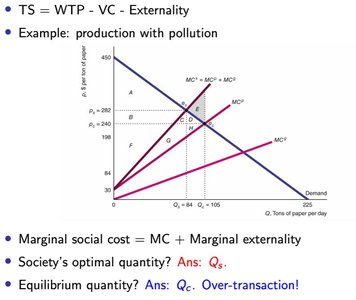
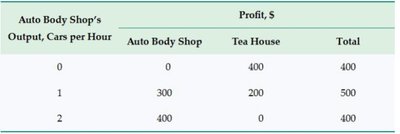
Negative externalities occur when a producer or consumer's actions harm others. The market equilibrium typically results in over-transaction compared to the social optimum.
Marginal Social Cost: Marginal externality
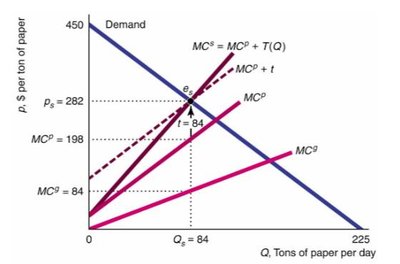
Remedies: Property rights (market approach), taxes, or quantity controls (regulation approach).
Positive Externalities
Positive externalities occur when actions benefit others. The market equilibrium results in under-transaction compared to the social optimum.
Marginal Social Benefit: Marginal externality
Remedies: Property rights (market approach), subsidies, government provision, or mandates (regulation approach).
Summary Table: Key Formulas
Average Product of Labor:
Profit:
Short-Run Total Cost:
Long-Run Average Cost:
Producer Surplus:
Consumer Surplus:
Total Surplus:
Additional info: All diagrams and tables included are directly relevant to the explanation of the adjacent paragraphs, visually reinforcing key microeconomic concepts.
