 Indietro
Microeconomics Study Guide: Demand, Supply, and Market Equilibrium
Guida di studio - Note intelligenti
 Appunti personalizzati basati sui tuoi materiali, ampliati con definizioni chiave, esempi e contesto.
Demand, Supply, and Equilibrium
Introduction to Markets
Markets are fundamental to microeconomics, serving as the arena where buyers and sellers interact to exchange goods and services. Understanding market dynamics is essential for analyzing how prices and quantities are determined.
Market: A group of economic agents trading a good or service, governed by rules and arrangements for trading.
Market Price: The price at which transactions occur between buyers and sellers.
Competitive Equilibrium Price: The price at which quantity demanded equals quantity supplied.
Perfectly Competitive Market: All sellers offer identical goods, and no individual buyer or seller can influence the market price; all are "price takers."
Examples: Agricultural markets, internet-based platforms (e.g., Amazon, eBay), and local farmer's markets.
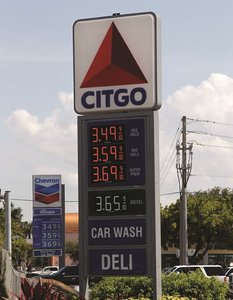




Additional info: The internet has increased market competitiveness by making price comparison easier.
Key Ideas in Market Analysis
Markets have two sides: demand (buyers) and supply (sellers).
Prices act as a selection device, encouraging trade between sellers with low costs and buyers with high willingness to pay.
Market price is determined when quantity demanded equals quantity supplied.
Few markets are perfectly competitive, but many approximate this ideal.
How Do Buyers Behave?
Demand Concepts
Buyers' behavior is captured by the demand curve, which shows how the quantity demanded varies with price.
Quantity Demanded: The amount buyers are willing to purchase at a given price.
Demand Schedule: A table reporting quantity demanded at different prices, holding all else equal.
Demand Curve: A graphical representation of the demand schedule.
Ceteris Paribus: Latin for "holding all else constant."
Willingness to Pay (WTP): The highest price a buyer is willing to pay.
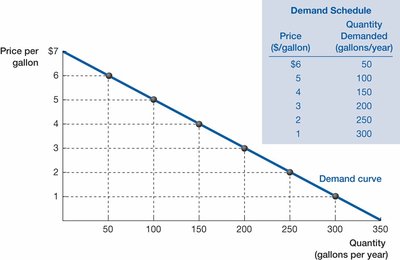
Market Demand Curve
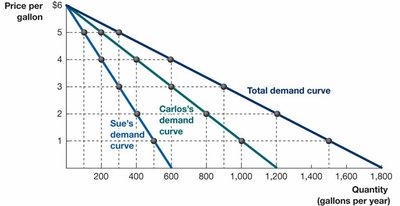
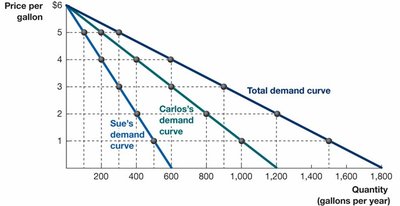
The market demand curve is the horizontal sum of individual demand curves, showing total quantity demanded at each price.
Law of Demand: Quantity demanded rises as price falls, holding all else equal.
Market demand is aggregated from individual demand schedules.
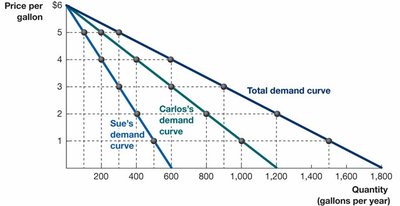
Price ($/gallon) | Sue's Quantity Demanded | Carlos's Quantity Demanded | Total Quantity Demanded |
|---|---|---|---|
5 | 100 | 200 | 300 |
4 | 200 | 400 | 600 |
3 | 300 | 600 | 900 |
2 | 400 | 800 | 1200 |
1 | 500 | 1000 | 1500 |
Shifts vs. Movements Along the Demand Curve
Understanding the difference between shifts and movements along the demand curve is crucial for analyzing market changes.
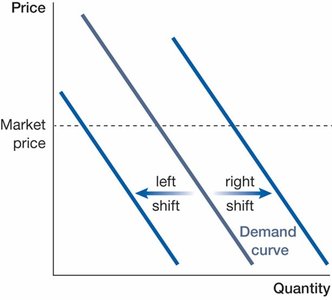
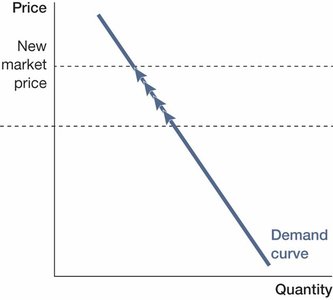
Movement along the demand curve: Caused by a change in the product's own price.
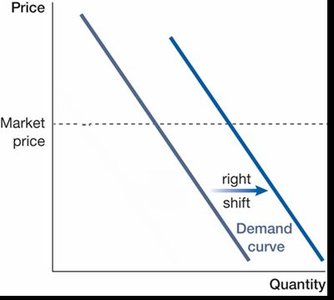
Shift of the demand curve: Caused by changes in tastes, income, prices of related goods, number of buyers, or expectations.
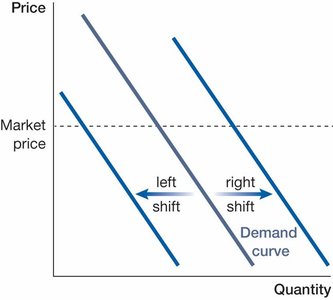
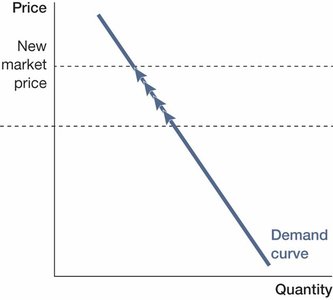
Factors Causing Demand Curve Shifts
Tastes and Preferences: Changes in what consumers value can shift demand. For example, if donuts are found to be healthy, demand increases.
Income and Wealth: Higher income increases demand for normal goods, decreases demand for inferior goods.
Availability and Prices of Related Goods: Complements and substitutes affect demand. E.g., cheaper coffee increases demand for donuts (complements).
Number and Scale of Buyers: More buyers shift demand right; fewer buyers shift demand left.
Buyers’ Expectations: Optimism about the future increases demand; pessimism decreases it.





How Do Sellers Behave?
Supply Concepts
Sellers' behavior is captured by the supply curve, which shows how the quantity supplied varies with price.
Quantity Supplied: The amount sellers are willing to sell at a given price.
Supply Schedule: A table reporting quantity supplied at different prices.
Supply Curve: A graphical representation of the supply schedule.
Willingness to Accept (WTA): The lowest price a seller is willing to accept.
Market Supply Curve
The market supply curve is the horizontal sum of individual supply curves, showing total quantity supplied at each price.
Law of Supply: Quantity supplied rises as price rises, holding all else equal.
Price ($/barrel) | Chevron's Quantity Supplied | ExxonMobil's Quantity Supplied | Total Quantity Supplied |
|---|---|---|---|
10 | 0.0 | 0.0 | 0.0 |
25 | 0.4 | 0.6 | 1.0 |
50 | 0.7 | 1.0 | 1.7 |
75 | 0.9 | 1.2 | 2.1 |
Shifts vs. Movements Along the Supply Curve
Understanding the difference between shifts and movements along the supply curve is crucial for analyzing market changes.
Movement along the supply curve: Caused by a change in the product's own price.
Shift of the supply curve: Caused by changes in input prices, technology, number of sellers, or expectations.
Factors Causing Supply Curve Shifts
Input Prices: Higher input prices decrease supply (shift left); lower input prices increase supply (shift right).
Technology: Improved technology increases supply (shift right).
Number and Scale of Sellers: More sellers increase supply (shift right); fewer sellers decrease supply (shift left).
Sellers’ Expectations: Expectations about future prices can affect current supply.
Summary Table: Demand and Supply Curve Shifts
Factor | Demand Curve Effect | Supply Curve Effect |
|---|---|---|
Tastes & Preferences | Shift right if positive, left if negative | No effect |
Income & Wealth | Shift right for normal goods, left for inferior goods | No effect |
Related Goods | Complements: shift right if price falls; Substitutes: shift right if price rises | No effect |
Number of Buyers/Sellers | More buyers: shift right; fewer: shift left | More sellers: shift right; fewer: shift left |
Expectations | Optimism: shift right; pessimism: shift left | Expect higher prices: decrease current supply |
Input Prices | No effect | Higher input prices: shift left; lower: shift right |
Technology | No effect | Improved technology: shift right |
Key Equations
Demand Function:
Supply Function:
Market Equilibrium:
Conclusion
Understanding demand and supply, and the factors that shift these curves, is essential for analyzing market outcomes. The equilibrium price and quantity are determined by the intersection of the demand and supply curves, and changes in external factors can shift these curves, leading to new market outcomes.
