 Indietro
Microeconomics Study Guide: Demand, Supply, and Market Equilibrium
Guida di studio - Note intelligenti
 Appunti personalizzati basati sui tuoi materiali, ampliati con definizioni chiave, esempi e contesto.
Chapter 3: Demand & Supply
Abstract and Introduction
This chapter explores the foundational concepts of demand and supply in microeconomics, focusing on how buyers and sellers interact in various markets to determine equilibrium price and quantity. The ideas of Adam Smith's Invisible Hand are introduced, emphasizing the self-regulating nature of markets.
SECTION I: MARKETS & PRICES
Markets
A market is a place or system where buyers and sellers exchange goods, services, or factors of production. Markets can be physical (like a grocery store) or virtual (such as the foreign exchange market).
Types of Markets: Goods (carrots, coffee), Services (haircuts, hotels), Factors of Production (labor, capital), Loanable Funds, Money, Bonds, Stocks, Commodities, Foreign Exchange.
Competitive Market: Many buyers and sellers; no single participant can influence the price.

Money Price and Relative Price
The money price is the amount of currency exchanged for a good or service. The relative price compares the price of one good to another, reflecting opportunity cost.
Formula:
Example: If Starbucks coffee costs \frac{4.50}{2.25} = 2$ cups of Tim Horton's.
Opportunity Cost: The value of the next best alternative forgone.

SECTION II: DEMAND
Definition and Requirements for Demand
Demand is the desire, ability, and plan to purchase a good or service. Three conditions must be met:
Want it: Unlimited desires for goods/services.
Can afford it: Based on available resources.
Plan to buy it: A definite intention to purchase.
Quantity Demanded
Quantity demanded (Qd) is the amount a consumer plans to buy at a specific price during a given time period. Changes in price cause movements along the demand curve.
Law of Demand
The Law of Demand states that, ceteris paribus, as the price of a good increases, the quantity demanded decreases, and vice versa.
Substitution Effect: Higher prices lead consumers to substitute with cheaper alternatives.
Income Effect: Higher prices reduce real income, decreasing quantity demanded.
Demand Curve and Schedule
The demand curve shows the relationship between price and quantity demanded. It is also known as the willingness and ability to pay curve, reflecting diminishing marginal benefit.
Demand Equation:
Demand Schedule: Table of prices and corresponding quantities demanded.
Change in Demand
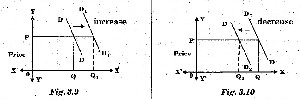
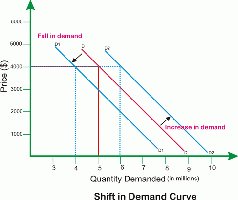
A change in demand occurs when factors other than price affect buying plans, shifting the demand curve.
(curve shifts right)
(curve shifts left)
Reasons for Demand Curve Shifts
Tastes & Preferences: More preference increases demand.
Population: Larger population increases demand.
Price of Substitutes: Higher price of substitute increases demand for the original good.
Price of Complements: Higher price of complement decreases demand for the original good.
Consumer Income: Normal goods (demand increases with income); Inferior goods (demand decreases with income).
Expected Future Income & Credit: Anticipated increases boost current demand.
Expected Future Prices: Anticipated price rises boost current demand.
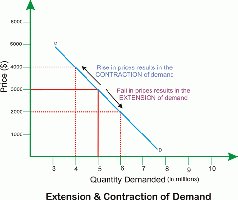
Change in Quantity Demanded vs Change in Demand
Movement along the demand curve is a change in quantity demanded; a shift of the curve is a change in demand.
SECTION III: SUPPLY
Definition and Requirements for Supply
Supply is the ability and plan to produce and sell a good or service. Three conditions must be met:
Has resources and technology to produce.
Can make a profit from production.
Plans to produce and sell the good.
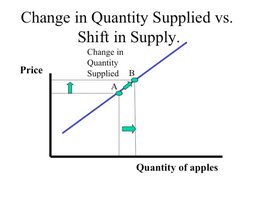
Quantity Supplied
Quantity supplied (Qs) is the amount a producer plans to sell at a specific price during a given time period. Changes in price cause movements along the supply curve.
Law of Supply
The Law of Supply states that, ceteris paribus, as the price of a good increases, the quantity supplied increases, and vice versa.
Reason: Marginal cost increases with quantity produced; higher prices are needed to cover additional costs.
Supply Curve and Schedule
The supply curve shows the relationship between price and quantity supplied. It is also known as the minimum-supply-price curve, reflecting marginal cost.
Supply Equation:
Supply Schedule: Table of prices and corresponding quantities supplied.
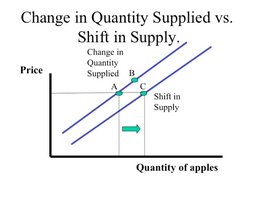
Change in Supply
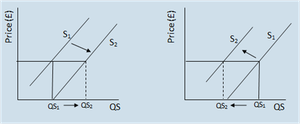
A change in supply occurs when factors other than price affect selling plans, shifting the supply curve.
(curve shifts right)
(curve shifts left)
Reasons for Supply Curve Shifts
Technology: Improvements increase supply.
Input Prices: Lower costs increase supply.
Number of Suppliers: More suppliers increase supply.
Price of Substitutes in Production: Higher price of substitute decreases supply of original good.
Price of Complements in Production: Higher price of complement increases supply of original good.
State of Nature: Favorable conditions increase supply; disasters decrease supply.
Expected Future Prices: Anticipated price drops increase current supply.
Taxes & Subsidies: Lower taxes and higher subsidies increase supply.
Change in Quantity Supplied vs Change in Supply
Movement along the supply curve is a change in quantity supplied; a shift of the curve is a change in supply.
SECTION IV: EQUILIBRIUM
Market Equilibrium
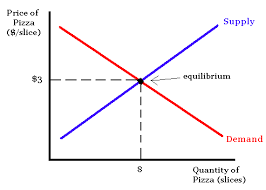
Market equilibrium occurs when quantity demanded equals quantity supplied in a competitive market. The equilibrium price is where this balance is achieved, and the equilibrium quantity is the amount bought and sold at that price.
Price Adjustments
Shortage (Excess Demand): ; price rises.
Surplus (Excess Supply): ; price falls.
SECTION V: PREDICTING CHANGES IN PRICE & QUANTITY
Shifts of Demand and Supply Curves
Changes in demand or supply affect market price and quantity. Four cases for single curve shifts:
Increase in Demand: Price and quantity rise.
Decrease in Demand: Price and quantity fall.
Increase in Supply: Price falls, quantity rises.
Decrease in Supply: Price rises, quantity falls.
Four cases for simultaneous shifts:
Increase in Both: Quantity rises, price indeterminate.
Decrease in Both: Quantity falls, price indeterminate.
Increase in Demand, Decrease in Supply: Price rises, quantity indeterminate.
Decrease in Demand, Increase in Supply: Price falls, quantity indeterminate.
Additional info: This guide expands on brief points with academic context, definitions, and examples to ensure completeness and clarity for exam preparation.
