 Indietro
Microeconomics Study Guide: Foundations, Scarcity, Demand & Supply, Elasticity, and Market Applications
Guida di studio - Note intelligenti
 Appunti personalizzati basati sui tuoi materiali, ampliati con definizioni chiave, esempi e contesto.
Chapter 1: The Scope and Method of Economics
What is Economics?
Economics is the study of how individuals, firms, and societies make choices regarding the allocation of limited resources. It fundamentally addresses the concept of scarcity, which refers to the limited availability of resources compared to the unlimited wants.
Scarcity: Not synonymous with poverty; scarcity means resources are limited, while poverty is a lack of basic needs due to insufficient income.
Microeconomics: Focuses on individual and firm decision-making and market interactions.
Macroeconomics: Examines government policies and interactions between economies.
Five Foundations of Economics
Incentives Matter: People respond to positive and negative incentives, which can have unintended consequences.
Life is About Tradeoffs: Every choice involves sacrificing alternatives.
Opportunity Cost: The value of the next best alternative forgone when making a decision.
Marginal Thinking: Evaluating the benefit versus cost of one additional unit.
Trade and Specialization: All parties benefit from trade and specializing in their comparative advantage.
Building Economic Models
Economists use the scientific method to construct models:
Observe a phenomenon
Develop a hypothesis
Construct a model
Test the model with experiments or real-world data
Ceteris Paribus: Holding all other variables constant when testing models.
Endogenous Variables: Controlled within the model.
Exogenous Variables: Outside the model's control.
Positive vs. Normative Analysis
Positive Statements: Testable and verifiable (e.g., "Nintendo Switch sold more consoles than Playstation 4").
Normative Statements: Opinion-based and not verifiable (e.g., "Nintendo Switch has better games").
Chapter 2: Scarcity and Choice
Opportunity Cost
Opportunity cost is the value of the next best alternative forgone to obtain something.
Example: Choosing between bus and plane travel, factoring in monetary cost and time value.
Formula: (solving for C, the value of time per hour).
Production Possibility Frontier (PPF)
The PPF illustrates the maximum output combinations of two goods that can be produced with fixed resources.
Movement along the curve shows opportunity cost.
Nonlinear PPF: Increasing opportunity cost as more of one good is produced.
Linear PPF: Constant opportunity cost.
Comparative and Absolute Advantage
Comparative Advantage: Producing a good at a lower opportunity cost than others.
Absolute Advantage: Producing more output with the same resources.
Specialization and trade allow both parties to achieve better outcomes than working alone.
Chapter 3: Demand and Supply
Law of Demand
The law of demand states that as the price of a good increases, the quantity demanded decreases, and vice versa.
Demand curve typically slopes downward.
Movement along the curve: Change in quantity demanded due to price change.
Shift of the curve: Change in demand due to factors other than price (e.g., income, tastes, prices of related goods).
Law of Supply
The law of supply states that as the price of a good increases, the quantity supplied increases.
Supply curve typically slopes upward.
Movement along the curve: Change in quantity supplied due to price change.
Shift of the curve: Change in supply due to factors such as input costs, technology, taxes, subsidies, and expectations.
Market Equilibrium
Market equilibrium occurs where quantity supplied equals quantity demanded (Qs = Qd). The market price adjusts to reach this point.
If Qs > Qd: Price falls.
If Qs < Qd: Price rises.
Chapter 5: Elasticity
Price Elasticity of Demand
Elasticity measures the responsiveness of quantity demanded to changes in price.
Formula:
Determinants: Number of substitutes, proportion of budget, time horizon.
Elastic demand: Large change in QD for a given price change.
Inelastic demand: Small change in QD for a given price change.
Calculating Elasticity
Percentage formula:
Midpoint formula:
Types of Demand Curves
Perfectly Inelastic: Vertical line,
Relatively Inelastic: Steep slope,
Relatively Elastic: Flat slope,
Perfectly Elastic: Horizontal line,
Unitary Elasticity:
Income Elasticity of Demand
Formula:
Normal goods:
Necessities:
Luxuries:
Inferior goods:
Cross Price Elasticity of Demand
Formula:
Substitutes:
Complements:
Price Elasticity of Supply
Formula:
Perfectly Inelastic: Vertical supply curve,
Relatively Inelastic: Steep supply curve,
Relatively Elastic: Flat supply curve,
Perfectly Elastic: Horizontal supply curve
Chapter 4: Demand and Supply Applications
Consumer Surplus, Producer Surplus, and Total Surplus
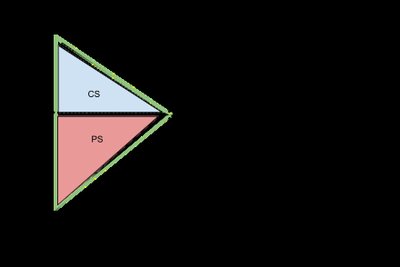
Consumer surplus is the difference between what consumers are willing to pay and what they actually pay. Producer surplus is the difference between the price received and the minimum price at which producers are willing to sell. Total surplus is the sum of consumer and producer surplus, representing the net benefit to society.
Consumer Surplus (CS): Area above the price and below the demand curve.
Producer Surplus (PS): Area below the price and above the supply curve.
Total Surplus (TS):
Market Efficiency
An allocation is efficient if it maximizes total surplus. The market equilibrium (where Qs = Qd) is efficient; any other price leaves buyers or sellers unmatched.
Gift giving may not be efficient if recipients value gifts less than their cost.
Equity concerns: Economists sometimes consider fair distribution of goods.
Taxes and Deadweight Loss
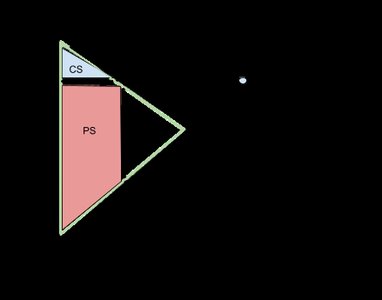
Per-unit taxes are taxes on each unit sold. The legal responsibility (levy) and actual burden (incidence) may differ. Taxes typically cause deadweight loss (DWL), reducing total surplus.
Tax Revenue: Added to total surplus.
Deadweight Loss (DWL): Lost surplus due to reduced economic activity.
Tax Incidence: The more elastic side pays a higher share of the tax.
Price Controls: Price Ceilings and Price Floors
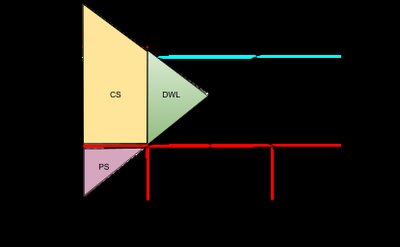
Price ceilings are legally imposed maximum prices, binding if below equilibrium. Price floors are legally imposed minimum prices, binding if above equilibrium. Both can cause inefficiencies and unintended consequences.
Price Ceiling: Can lead to shortages and black markets (e.g., rent control).
Price Floor: Can lead to surpluses and unemployment (e.g., minimum wage).
Examples and Applications
Tariffs: Raise price and reduce quantity of imported goods.
Price gouging: Illegal during emergencies, acts as a price ceiling.
Minimum wage: If binding, causes unemployment and may lead to automation or relocation.
Extreme cases: Zimbabwe's hyperinflation, organ price ceilings leading to black markets.
Additional info: Academic context and formulas have been expanded for clarity and completeness. Images included are directly relevant to the explanation of consumer/producer surplus, tax incidence, and minimum wage as a price floor.
