 Indietro
Microeconomics Study Guide: Principles, Optimization, and Market Equilibrium
Guida di studio - Note intelligenti
 Appunti personalizzati basati sui tuoi materiali, ampliati con definizioni chiave, esempi e contesto.
Principles and Practice of Economics
Three Principles of Economics
Economics is fundamentally concerned with how individuals and groups make choices in the face of scarcity. The discipline is unified by three core principles:
Optimization: Making the best possible choice with the available information. All optimization problems involve trade-offs, as choosing one option often means forgoing another.
Equilibrium: A situation in which everyone is optimizing and no one can benefit by changing their behavior. For example, in a supermarket, if no one is switching checkout lanes, the system is in equilibrium.
Empiricism: Using data to answer questions and quantify the world. Empirical analysis helps economists understand and predict behavior.
Key Economic Concepts
Economic Agent: Any individual or group making choices, such as consumers, firms, or governments.
Scarcity: The condition of having unlimited wants in a world of limited resources. Scarcity necessitates choice and is central to economics.
Positive Economics: Describes what people actually do.
Normative Economics: Recommends what people ought to do.
Microeconomics: The study of individual, firm, and government choices.
Macroeconomics: The study of the economy as a whole.
Trade-offs: Occur when some benefits must be given up to gain others.
Budget Constraint: The set of choices available without exceeding one's budget.
Opportunity Cost: The value of the best alternative forgone.
Free Rider Problem: When individuals enjoy benefits without incurring costs.
Optimization: Trying to Do the Best You Can
Optimization Techniques
Optimization is the process of finding the best feasible option. Economists use two main techniques:
Total Value: Calculate net benefit by subtracting total cost from total benefit. Choose the option with the highest net benefit.
Marginal Analysis: Focuses on the change in net benefit when moving between alternatives. It is faster and emphasizes what is changing.
Steps for Optimization Using Total Value
Translate all costs and benefits into common units (e.g., dollars per month).
Calculate the total net benefit for each alternative.
Choose the alternative with the highest net benefit.
Steps for Optimization Using Marginal Analysis
Translate all costs and benefits into common units.
Calculate the marginal consequences of moving between alternatives.
Choose the alternative where moving to it makes you better off and moving away makes you worse off.
Marginal Concepts and Formulas
Marginal Cost (MC): The change in costs between alternatives.
Marginal Benefit (MB): The change in benefits between alternatives.
Marginal Net Benefit (MNB): The change in net benefits between alternatives.
Demand, Supply, and Equilibrium
Market Fundamentals
A market is a group of economic agents trading a good or service, governed by rules and arrangements. The market price is the price at which transactions occur.
Demand
Quantity Demanded: The amount buyers are willing to purchase at a given price.
Demand Schedule: A table showing quantity demanded at various prices.
Demand Curve: A graph plotting quantity demanded against price. It slopes downward due to diminishing marginal benefit.
Diminishing Marginal Benefit: As consumption increases, willingness to pay for additional units decreases.
Law of Demand: Quantity demanded rises as price falls, holding all else equal.
Market Demand Curve: The sum of individual demand curves, showing total quantity demanded at each price.
Demand Schedules and Curves
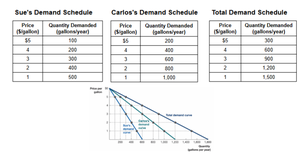
The following table illustrates individual and total demand schedules for gasoline:
Price ($/gallon) | Sue's Quantity Demanded (gallons/year) | Carlos's Quantity Demanded (gallons/year) | Total Quantity Demanded (gallons/year) |
|---|---|---|---|
5 | 100 | 200 | 300 |
4 | 200 | 400 | 600 |
3 | 400 | 600 | 1,000 |
2 | 600 | 900 | 1,500 |
Shifts vs. Movements Along the Demand Curve
Movement along the curve: Caused only by changes in the product's own price.
Shifts of the curve: Caused by changes in tastes, income, prices of related goods, number of buyers, or expectations.
Types of Goods
Normal Goods: Demand increases as income increases.
Inferior Goods: Demand decreases as income increases.
Complements: Goods consumed together; a price increase in one reduces demand for both.
Substitutes: Goods consumed instead of each other; a price increase in one increases demand for the other.
Supply
Quantity Supplied: The amount sellers are willing to sell at a given price.
Supply Schedule: A table showing quantity supplied at various prices.
Supply Curve: A graph plotting quantity supplied against price. It typically slopes upward.
Law of Supply: Quantity supplied rises as price rises, holding all else equal.
Market Supply Curve: The sum of individual supply curves, showing total quantity supplied at each price.
Supply Schedules and Curves
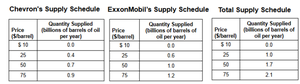
The following table illustrates individual and total supply schedules for oil:
Price ($/barrel) | Chevron's Quantity Supplied (billions/year) | ExxonMobil's Quantity Supplied (billions/year) | Total Quantity Supplied (billions/year) |
|---|---|---|---|
10 | 0 | 0 | 0 |
25 | 0.4 | 0.6 | 1.0 |
50 | 1.7 | 1.7 | 3.4 |
75 | 2.1 | 1.2 | 3.3 |
Shifts vs. Movements Along the Supply Curve
Movement along the curve: Caused only by changes in the product's own price.
Shifts of the curve: Caused by changes in input prices, technology, number of sellers, or expectations.
Market Equilibrium
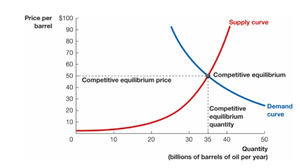
Competitive equilibrium occurs when the market price equates quantity demanded and quantity supplied. At this point, the market agrees on both the price and the quantity exchanged.
Excess Demand: When consumers want more than suppliers provide at a given price, resulting in a shortage.
Excess Supply: When suppliers provide more than consumers want at a given price, resulting in a surplus.
Equilibrium Formulas
Equilibrium Price: The price at which quantity demanded equals quantity supplied.
Equilibrium Quantity: The quantity exchanged at the equilibrium price.
Example: If the supply and demand curves intersect at $50 per barrel and 35 billion barrels per year, then $50 is the competitive equilibrium price and 35 billion barrels is the competitive equilibrium quantity.
Summary Table: Demand and Supply Concepts
Concept | Definition | Example |
|---|---|---|
Optimization | Best choice given information | Choosing the checkout lane with the shortest wait |
Equilibrium | No one benefits by changing behavior | No one switches lanes in a supermarket |
Marginal Analysis | Change in net benefit between alternatives | Comparing cost and benefit of buying one more unit |
Law of Demand | Quantity demanded rises as price falls | Buying more gasoline as price drops |
Law of Supply | Quantity supplied rises as price rises | Oil companies supply more as price increases |
Competitive Equilibrium | Quantity demanded equals quantity supplied | Market price and quantity agreed upon |
