 Indietro
Microeconomics Study Notes: Scarcity, Choice, and Market Equilibrium
Guida di studio - Note intelligenti
 Appunti personalizzati basati sui tuoi materiali, ampliati con definizioni chiave, esempi e contesto.
The Scope and Method of Economics
Definition and Fundamental Concepts
Economics is the study of how individuals and societies allocate scarce resources provided by nature and previous generations. Scarcity arises when resources are insufficient to satisfy all wants at a zero price, making choices necessary.
Scarcity: The fundamental economic problem of having limited resources to meet unlimited wants.
Resources: Classified as land (natural resources), labor (human effort), and capital (produced goods used for further production).
Physical Capital: Tools, machines, factories.
Human Capital: Skills acquired through education and training.
Economies must answer three main questions:
What to produce?
How to produce?
For whom to produce?
These questions are addressed through different economic systems:
Command Economy: Central authority decides.
Free Market Economy: Markets determine outcomes.
Mixed Economy: Combines elements of both systems.
Microeconomics vs. Macroeconomics
Microeconomics: Examines individual industries, firms, and households.
Macroeconomics: Studies aggregates like national income, employment, and growth.
Positive vs. Normative Economics
Positive Economics: Describes and predicts economic phenomena; testable statements.
Normative Economics: Prescribes what ought to be; involves value judgments.
Scientific Method in Economics
Observation
Inductive reasoning to form theories
Testing hypotheses
Modification of theories
Models and Assumptions
Model: Simplified representation of reality to explain or predict economic relationships.
Ockham's Razor: Irrelevant details should be eliminated.
Key Assumptions: People are rational; "Ceteris paribus" (all else equal).
Common Fallacies
Post hoc ergo propter hoc: Assuming causation from sequence.
Fallacy of composition: Assuming what is true for one is true for all.
The Economic Problem: Scarcity and Choice
Opportunity Cost and Sunk Costs
Every choice involves an opportunity cost—the value of the best alternative forgone. Sunk costs are unrecoverable and should not influence current decisions.
Opportunity Cost: The value of the next best alternative given up.
Sunk Costs: Costs that cannot be recovered; should be ignored in decision-making.
Production Possibilities Frontier (PPF)
Definition and Assumptions
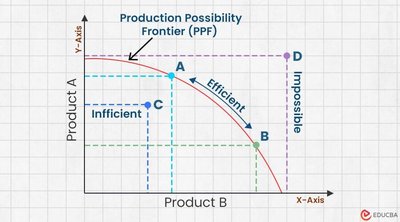
The PPF is a graph showing all possible combinations of two goods that can be produced using all resources efficiently over a specific period, with fixed resources and technology.
Assumes two types of goods: consumer and capital goods.
Points inside the PPF: Inefficient or underutilized resources.
Points outside the PPF: Unattainable with current resources.
Shifts in the PPF: Caused by changes in resources or technology (economic growth).
Main Properties of the PPF
Downward Sloping: Reflects opportunity cost.
Bowed Out: Illustrates the Law of Increasing Opportunity Cost.
Efficient Points: On the PPF; all resources fully utilized.
Inefficient Points: Inside the PPF; resources not fully utilized.
Impossible Points: Outside the PPF; unattainable with current resources.
Marginal Rate of Transformation (MRT)
The MRT is the rate at which one good can be traded for another in production, represented by the slope of the PPF.
Formula:
Law of Increasing Opportunity Cost
As production of a good increases, the opportunity cost of producing additional units rises because resources are not equally suited for all goods.
Resources must be reallocated from their best uses, increasing the cost.
Absolute and Comparative Advantage
Countries can benefit from trade by specializing according to their comparative advantage.
Absolute Advantage: Producing more of a good with fewer resources.
Comparative Advantage: Producing a good at a lower opportunity cost.
Example: New Zealand and Australia
Country | Wheat (units/acre) | Cotton (units/acre) |
|---|---|---|
New Zealand | 6 | 2 |
Australia | 2 | 6 |
With specialization and trade, both countries can achieve higher total output and consumption.
Demand, Supply, and Market Equilibrium
Demand
Demand refers to the quantity of a good that consumers are willing and able to purchase at various prices.
Quantity Demanded (Qd): Amount purchased at a specific price.
Demand Schedule: Table showing Qd at different prices.
Law of Demand: Inverse relationship between price and Qd, ceteris paribus.
Demand Curve: Graphical representation of the demand schedule.
Change in Quantity Demanded vs. Change in Demand
Change in Qd: Movement along the demand curve due to price change.
Change in Demand: Shift of the demand curve due to factors other than price.
Factors Affecting Demand
Preferences
Income (Normal vs. Inferior goods)
Price of related goods (Complements and Substitutes)
Expectations
Number of consumers
Advertising and government policies
Supply
Supply is the quantity of a good that firms are willing to produce and sell at various prices.
Quantity Supplied (Qs): Amount produced at a specific price.
Supply Schedule: Table showing Qs at different prices.
Law of Supply: Direct relationship between price and Qs, ceteris paribus.
Change in Quantity Supplied vs. Change in Supply
Change in Qs: Movement along the supply curve due to price change.
Change in Supply: Shift of the supply curve due to factors other than price.
Factors Affecting Supply
Cost of production (input prices, technology)
Number of firms
Government policies (regulations, taxes)
Weather
Market Equilibrium
Market equilibrium occurs when quantity demanded equals quantity supplied, resulting in no tendency for price to change.
Equilibrium Price (P*): Price at which Qd = Qs.
Excess Demand (Shortage): Qd > Qs; price tends to rise.
Excess Supply (Surplus): Qd < Qs; price tends to fall.
Market clears: When Qd = Qs.
Example Equations
Demand:
Supply:
Equilibrium: Set to solve for
Price Controls
Price Floor: Minimum price set by government; above equilibrium creates surplus.
Price Ceiling: Maximum price set by government; below equilibrium creates shortage.
Additional info: These notes expand on brief points with academic context, definitions, and examples to provide a comprehensive study guide for microeconomics students.
