 Indietro
Microeconomics: Using Data and Models to Understand the World
Guida di studio - Note intelligenti
 Appunti personalizzati basati sui tuoi materiali, ampliati con definizioni chiave, esempi e contesto.
Chapter 2: Economic Science – Using Data and Models to Understand the World
Introduction
This chapter explores how economists use the scientific method, data, and models to analyze and understand economic phenomena. It emphasizes the importance of distinguishing between correlation and causation, constructing testable models, and formulating meaningful economic questions.
The Scientific Method in Economics
Definition and Steps
The Scientific Method is a systematic approach to understanding the world through observation, model-building, and empirical testing.
In economics, it involves two main steps:
Developing a model or theory to explain part of the world.
Testing the model using data to see how well it matches observed reality.
Empiricism refers to gathering and using data to understand economic behavior.
Core scientific principles in economics: optimization and equilibrium.

Additional info: Models are simplified representations of reality, not perfect copies, but they help us make predictions and understand complex systems.
Models and Theories
A model is a simplified description of reality, often used interchangeably with the term theory.
Models are built on assumptions—educated simplifications based on prior research or logical reasoning.
Models are useful for making predictions that can be tested with data.
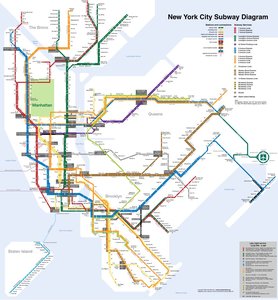
Example: A subway map is a model that simplifies the complex geography of a city to help users navigate the transit system.
Limitations of Models
Models are not exact; they are approximations.
Predictions from models can be tested and refined with new data.
Assumptions should be reasonable and based on evidence.
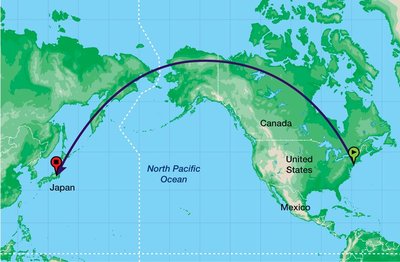
Example: Flat maps are useful models for some purposes but distort reality for others, such as calculating flight paths.
Correlation and Causation
Definitions
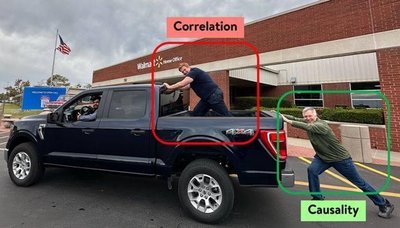
Correlation: When two variables move together, either in the same or opposite directions.
Causation: When one variable directly affects another.
Correlation does not imply causation; further investigation is needed to establish a causal relationship.
Types of Correlation
Positive correlation: Both variables move in the same direction.
Negative correlation: Variables move in opposite directions.
Common Pitfalls
Omitted Variable Bias: Failing to include a relevant variable that influences both variables of interest can lead to misleading correlations.
Reverse Causality: When the direction of cause and effect is opposite to what is assumed.
Argument by Anecdote: Drawing broad conclusions from a single or small number of cases is unreliable.

Spurious Correlations
Sometimes, two variables appear to be correlated due to coincidence or a third factor, not because one causes the other.

Testing Causality: Experiments in Economics
Controlled Experiments
Subjects are randomly assigned to treatment and control groups.
Randomization ensures that differences in outcomes can be attributed to the treatment.
Common in medicine, but sometimes possible in economics (e.g., field experiments).
Natural Experiments
Assignment to treatment or control groups is determined by external factors (e.g., policy changes, natural disasters).
Allows economists to study causal effects when controlled experiments are not feasible.
Evidence-Based Economics: The Return to Education
Formulating the Question
Research question: Is college worth it?
Model: Each additional year of education increases future earnings by a certain percentage (e.g., 10%).
Assumptions are based on prior studies (e.g., UK schooling policy in the 1940s).

Calculating Returns
If a worker earns $15/hour with 13 years of education, and each additional year increases earnings by 10%:
Thus, four more years (college degree) increases wages from $15 to $21.97, or 46.5%.
Empirical Evidence
Data from the U.S. Current Population Survey shows median annual earnings for college graduates are $55,660, compared to $35,620 for high school graduates.
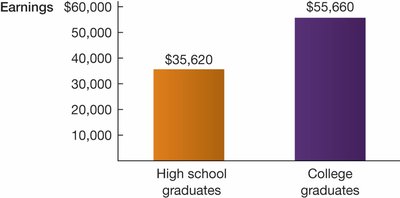
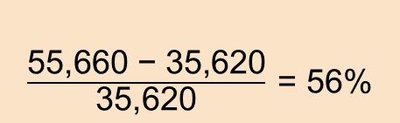
The model predicted a 46% increase; the data show a 56% increase, indicating the model is a reasonable approximation.
Limitations and Considerations
Not all college graduates earn the same; factors such as major, location, and job type matter.
Means can be skewed by outliers; medians often provide a better measure of central tendency.
Formulating Good Economic Questions
Properties of Good Economic Questions
Relevant and important: The question should contribute to social welfare.
Empirically answerable: The question can be tested with data and evidence.
Examples of good economic questions:
Would a smoker quit for $100 a month?
Will free trade cause job loss?
What is the optimal size of government?
Is there discrimination in the labor market?
Do people care about fairness?
How often do banks fail?
Summary Table: Key Concepts
Concept | Definition | Example |
|---|---|---|
Model | Simplified description of reality | Subway map, wage prediction model |
Correlation | Two variables move together | Margarine consumption and divorce rate |
Causation | One variable directly affects another | Education increases earnings |
Controlled Experiment | Random assignment to treatment/control | Drug trials, field experiments |
Natural Experiment | Assignment by external factors | Policy changes, natural disasters |
