 Indietro
Supply and Demand: Demand Curves, Shifters, and Related Goods
Guida di studio - Note intelligenti
 Appunti personalizzati basati sui tuoi materiali, ampliati con definizioni chiave, esempi e contesto.
Demand Curves and Demand Schedules
Understanding the Demand Curve
The demand curve is a graphical representation of the relationship between the price of a good and the quantity demanded by consumers, holding all other factors constant. It typically slopes downward, indicating that as price decreases, the quantity demanded increases.
Law of Demand: All else equal, as the price of a good falls, the quantity demanded rises, and vice versa.
Demand Schedule: A table that shows the quantity demanded at each price level.
Example: The table below is a demand schedule, and the graph next to it is the corresponding demand curve.
Price | Quantity |
|---|---|
0 | 230 |
5 | 200 |
10 | 180 |
20 | 110 |
30 | 60 |
40 | 45 |
50 | 30 |
60 | 25 |
75 | 20 |
90 | 0 |
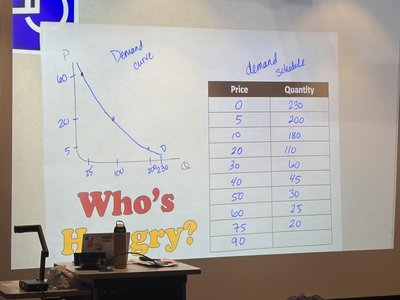
Additional info: The demand curve is drawn by plotting the price (vertical axis) against the quantity demanded (horizontal axis) for each entry in the demand schedule.
External Factors That Shift Demand Curves
Determinants of Demand (Demand Shifters)
While the demand curve shows the effect of price on quantity demanded, several external factors can shift the entire demand curve to the right (increase in demand) or left (decrease in demand). These are known as demand shifters:
Price of Related Goods and Services: Changes in the prices of substitutes or complements affect demand.
Income: Changes in consumer income can increase or decrease demand, depending on the type of good.
Tastes and Preferences: Changes in consumer preferences can shift demand.
Expectations: Expectations about future prices or income can affect current demand.
Number of Consumers: An increase in the number of buyers increases market demand.
Note: All these factors can be related to the concept of opportunity cost, as consumers make choices based on the relative value of alternatives.
Income and Demand: Normal vs. Inferior Goods
How Income Affects Demand
Normal Good: Demand increases as income increases. Example: Organic food, electronics.
Inferior Good: Demand decreases as income increases. Example: Instant noodles, bus rides.
Example: As consumers' incomes rise, they may buy more restaurant meals (normal good) and fewer instant noodles (inferior good).
Related Goods: Substitutes and Complements
Definitions and Effects on Demand
Substitutes: Goods that can replace each other. An increase in the price of one increases the demand for the other. Example: Butter and margarine.
Complements: Goods that are used together. An increase in the price of one decreases the demand for the other. Example: Printers and ink cartridges.
Example: If the price of coffee rises, the demand for tea (a substitute) may increase. If the price of smartphones rises, the demand for phone cases (a complement) may decrease.
Application: Demand for Gasoline
Economic Growth and Demand
As the economy grows, more consumers have income and the number of drivers increases, leading to higher demand for gasoline.
This increased demand shifts the demand curve to the right, resulting in higher equilibrium prices for gasoline.
Example: During periods of economic expansion, gasoline prices often rise due to increased demand from more drivers and higher economic activity.
